Exam 10: Project Scheduling: Lagging, Crashing, and Activity Networks
Exam 1: Introduction: Why Project Management105 Questions
Exam 2: The Organizational Context: Strategy, Structure, and Culture105 Questions
Exam 3: Project Selection and Portfolio Management103 Questions
Exam 4: Leadership and the Project Manager112 Questions
Exam 5: Scope Management111 Questions
Exam 6: Project Team Building, Conflict, and Negotiation102 Questions
Exam 7: Risk Management102 Questions
Exam 8: Cost Estimation and Budgeting105 Questions
Exam 9: Project Scheduling: Networks, Duration Estimation, and Critical Path105 Questions
Exam 10: Project Scheduling: Lagging, Crashing, and Activity Networks96 Questions
Exam 11: Advanced Topics in Planning and Scheduling: Agile and Critical Chain105 Questions
Exam 12: Resource Management98 Questions
Exam 13: Project Evaluation and Control107 Questions
Exam 14: Project Closeout and Termination101 Questions
Select questions type
Which of these approaches will NOT accelerate the completion of a project?
(Multiple Choice)
4.8/5  (41)
(41)
The AOA network described by this table needs: Activity Predecessor -- -- A , ,
(Multiple Choice)
4.8/5 (32)
Sketch a network and use it as an example as you discuss the four different logical relationships between activities.
(Essay)
4.9/5 (41)
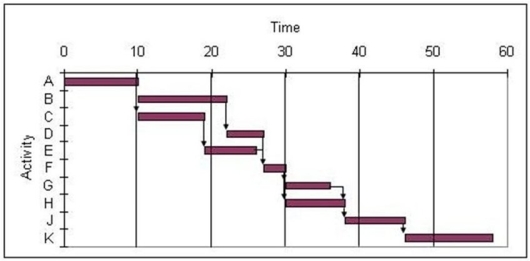 -Use the Gantt chart and the activity list to determine when resource 2 is free. Activity Resources Activity Resources A 1 1 5 2 4 5 3 3 2 2
(Multiple Choice)
4.7/5 (40)
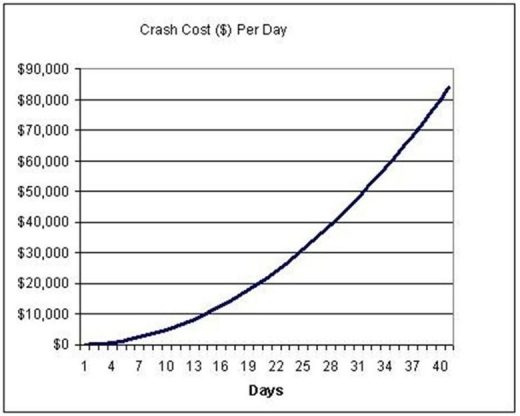
Crashing costs for a project are governed by the function:
50t² + 100t
where t represents the number of days crashed (see graph).The project manager wants to crash the project,and is willing to pay up to $1,000 per day saved.How many days can be saved before the per-day cost is too high?
(Essay)
4.9/5 (33)
What is the early start time for activity C if it has the start to start relationship shown? 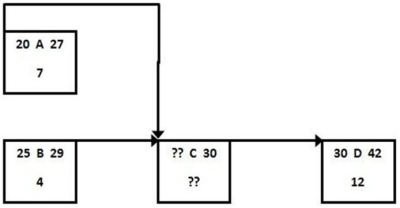
(Multiple Choice)
4.7/5 (33)
-Use the Gantt chart and the activity list to determine which resource is used the most. Activity Resources Activity Resources 1 F 2 3 3 4 4 2 5 2 1
(Multiple Choice)
4.9/5 (44)
What are four criticisms and caveats to bear in mind as you develop a project activity network?
(Essay)
4.8/5 (34)
Dummy activities are used in AOA networks to indicate the existence of precedent relationships between activities and their event nodes.
(True/False)
4.8/5 (42)
Use the information in the table (all times are in days)to determine the lowest total cost for a 20-day project if the base cost for each activity finished in normal time is $1,000. Normal Minimum Crash Cost Activity Time Time ( \/ day) Predecessor 10 6 \ 70 -- 6 3 \ 40 -- 2 2 - 4 2 \ 60 6 4 \ 80 8 5 \ 90 ,
(Multiple Choice)
4.9/5 (26)
What information is NOT included in the nodes for an AOA network?
(Multiple Choice)
4.8/5 (30)
Use the information in the table to create a baseline Gantt chart for the project where activity lengths are given in days.
Activity Duration Predecessor 6 - 3 7 5 10 8 , 6 4 10 5 ,
(Essay)
4.8/5 (31)
-Use the Gantt chart and the activity list to determine which resource is used the least. Activity Resources Activity Resources 1 2 1 3 4 4 2 3 2 K 5
(Multiple Choice)
4.8/5 (34)
An activity performed by a subcontractor is scheduled for 20 weeks at an anticipated cost of $100,000.Due to slippage on the critical path you need to reduce this activity by three weeks.If the subcontractor informs you that the activity can be completed in 16 weeks for $200,000,what is the slope for the activity?
(Multiple Choice)
4.7/5 (33)
A project has the activity duration and cost information indicated in the table where all times are in weeks.There is a penalty of $250 per week for every week the project extends beyond 32 weeks.What is the cost of the least expensive project possible? Activity Narmal time Crash time Narmal Cust Crash Cast Predecessar A 8 5 \ 1,000 2,000 B 6 4 1,500 2,000 A 8 5 1,800 2,300 A 12 9 1,000 1,800 14 11 950 1,450 9 7 1,500 1,900 , 7 5 2,300 2,800 ,
(Multiple Choice)
4.7/5 (39)
A project has the activity duration and cost information indicated in the table where all times are in weeks.What is the total cost for completing this project in 40 days? Normal Normal Activity Predecessor Time Cost Crash Time Crash Cost - 8 \ 12,000 5 \ 22,000 12 \ 18,000 9 \ 32,000 15 \ 22,000 9 \ 62,000 3 \ 9,000 2 \ 18,000 9 \ 15,000 5 \ 35,000 7 \ 5,000 5 \ 8,000 8 \ 13,000 6 \ 23,000 12 \ 20,000 8 \ 32,000 6 \ 45,000 4 \ 56,000
(Multiple Choice)
4.9/5 (35)
Mick has a project consisting of eight activities as listed in the table (with durations in days).He assigned his intern Guinness to sketch a network diagram in AOA and Guinness produced the sketch shown below.Determine the early and late start and finish times for all of these activities.
Activity Activity time 6 8 5 9 12 11 6 3 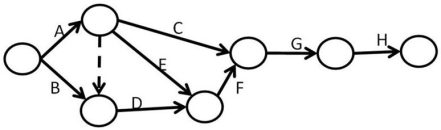
(Essay)
4.7/5 (38)
Networks are adaptable and useful for all scheduling challenges that an organization faces.
(True/False)
4.9/5 (45)
A project has the activity duration and cost information indicated in the table where all times are in weeks.What is the lowest total cost for completing this project in 33 weeks? Activity Narmal time Crash time Narmal Cust Crash Cast Predecessar A 8 5 \1 ,000 2,000 B 6 4 1,500 2,000 A 8 5 1,800 2,300 A 12 9 1,000 1,800 14 11 950 1,450 9 7 1,500 1,900 , 7 5 2,300 2,800 ,
(Multiple Choice)
4.9/5 (40)
Filters
- Essay(0)
- Multiple Choice(0)
- Short Answer(0)
- True False(0)
- Matching(0)