Exam 6: Capital Allocation to Risky Assets
Exam 1: The Investment Environment58 Questions
Exam 2: Asset Classes and Financial Instruments86 Questions
Exam 3: How Securities Are Traded69 Questions
Exam 4: Mutual Funds and Other Investment Companies72 Questions
Exam 5: Risk, Return, and the Historical Record85 Questions
Exam 6: Capital Allocation to Risky Assets70 Questions
Exam 7: Optimal Risky Portfolios80 Questions
Exam 8: Index Models87 Questions
Exam 9: The Capital Asset Pricing Model83 Questions
Exam 10: Arbitrage Pricing Theory and Multifactor Models of Risk and Return80 Questions
Exam 11: The Efficient Market Hypothesis71 Questions
Exam 12: Behavioral Finance and Technical Analysis54 Questions
Exam 13: Empirical Evidence on Security Returns56 Questions
Exam 14: Bond Prices and Yields129 Questions
Exam 15: The Term Structure of Interest Rates49 Questions
Exam 16: Managing Bond Portfolios84 Questions
Exam 17: Macroeconomic and Industry Analysis90 Questions
Exam 18: Equity Valuation Models130 Questions
Exam 19: Financial Statement Analysis91 Questions
Exam 20: Options Markets: Introduction108 Questions
Exam 21: Option Valuation90 Questions
Exam 22: Futures Markets91 Questions
Exam 23: Futures, Swaps, and Risk Management56 Questions
Exam 24: Portfolio Performance Evaluation83 Questions
Exam 25: International Diversification52 Questions
Exam 26: Hedge Funds49 Questions
Exam 27: The Theory of Active Portfolio Management50 Questions
Exam 28: Investment Policy and the Framework of the Cfa Institute83 Questions
Select questions type
Your client, Bo Regard, holds a complete portfolio that consists of a portfolio of risky assets (P) and T-Bills.The information below refers to these assets. 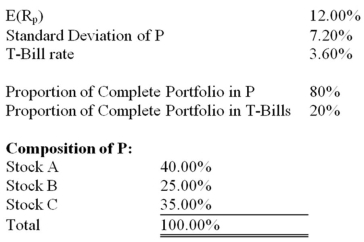 What is the standard deviation of Bo's complete portfolio
(Multiple Choice)
4.9/5  (37)
(37)
According to the mean-variance criterion, which of the statements below is correct 
(Multiple Choice)
4.9/5 (40)
You are considering investing $1,000 in a T-bill that pays 0.05 and a risky portfolio, P, constructed with two risky securities, X and Y.The weights of X and Y in P are 0.60 and 0.40, respectively.X has an expected rate of return of 0.14 and variance of 0.01, and Y has an expected rate of return of 0.10 and a variance of 0.0081. If you want to form a portfolio with an expected rate of return of 0.10, what percentages of your money must you invest in the T-bill, X, and Y, respectively, if you keep X and Y in the same proportions to each other as in portfolio P
(Multiple Choice)
4.8/5 (30)
Which of the following statements is(are) false
I. Risk-averse investors reject investments that are fair games.
II. Risk-neutral investors judge risky investments only by the expected returns.
III. Risk-averse investors judge investments only by their riskiness.
IV. Risk-loving investors will not engage in fair games.
(Multiple Choice)
4.7/5 (33)
You invest $100 in a risky asset with an expected rate of return of 0.12 and a standard deviation of 0.15 and a T-bill with a rate of return of 0.05. The slope of the capital allocation line formed with the risky asset and the risk-free asset is equal to
(Multiple Choice)
4.9/5 (39)
You are considering investing $1,000 in a T-bill that pays 0.05 and a risky portfolio, P, constructed with two risky securities, X and Y.The weights of X and Y in P are 0.60 and 0.40, respectively.X has an expected rate of return of 0.14 and variance of 0.01, and Y has an expected rate of return of 0.10 and a variance of 0.0081. What would be the dollar values of your positions in X and Y, respectively, if you decide to hold 40% of your money in the risky portfolio and 60% in T-bills
(Multiple Choice)
4.9/5 (27)
Discuss the differences between investors who are risk averse, risk neutral, and risk loving.
(Essay)
4.9/5 (38)
Consider a risky portfolio, A, with an expected rate of return of 0.15 and a standard deviation of 0.15, that lies on a given indifference curve.Which one of the following portfolios might lie on the same indifference curve
(Multiple Choice)
4.9/5 (34)
Toby and Hannah are two risk-averse investors.Toby is more risk-averse than Hannah.Draw one indifference curve for Toby and one indifference curve for Hannah on the same graph.Show how these curves illustrate their relative levels of risk aversion.
(Essay)
4.9/5 (40)
Filters
- Essay(0)
- Multiple Choice(0)
- Short Answer(0)
- True False(0)
- Matching(0)