Exam 21: The Theory of Consumer Choice
Exam 1: Ten Principles of Economics439 Questions
Exam 2: Thinking Like an Economist617 Questions
Exam 3: Interdependence and the Gains From Trade527 Questions
Exam 4: The Market Forces of Supply and Demand698 Questions
Exam 5: Elasticity and Its Application595 Questions
Exam 6: Supply, Demand, and Government Policies644 Questions
Exam 7: Consumers, Producers, and the Efficiency of Markets549 Questions
Exam 8: Application: The Costs of Taxation511 Questions
Exam 9: Application: International Trade493 Questions
Exam 10: Externalities524 Questions
Exam 11: Public Goods and Common Resources433 Questions
Exam 12: The Design of the Tax System551 Questions
Exam 13: The Costs of Production420 Questions
Exam 14: Firms in Competitive Markets543 Questions
Exam 15: Monopoly637 Questions
Exam 16: Monopolistic Competition587 Questions
Exam 17: Oligopoly496 Questions
Exam 18: The Markets for the Factors of Production564 Questions
Exam 19: Earnings and Discrimination490 Questions
Exam 20: Income Inequality and Poverty457 Questions
Exam 21: The Theory of Consumer Choice440 Questions
Exam 22: Frontiers of Microeconomics441 Questions
Select questions type
Assume that a consumer faces the following budget constraints. 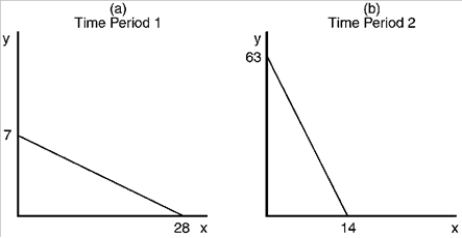 a. Assuming that income is the same on both occasions, describe the difference in relative prices between Panel A and Panel B.
b. If income in Panel B is $126, what is the price of good X?
c. If income in Panel A is $84, what is the price of good Y?
d. Assuming that the price of good X is the same on both occasions, describe the difference in income and price of good Y between Panel A and Panel B.
a. Assuming that income is the same on both occasions, describe the difference in relative prices between Panel A and Panel B.
b. If income in Panel B is $126, what is the price of good X?
c. If income in Panel A is $84, what is the price of good Y?
d. Assuming that the price of good X is the same on both occasions, describe the difference in income and price of good Y between Panel A and Panel B.
(Essay)
4.8/5  (39)
(39)
Jake experiences an increase in his wages. The hours of labor that he supplies to the market would decrease if
(Multiple Choice)
4.8/5 (32)
If income increases and prices are unchanged, the consumer's budget constraint
(Multiple Choice)
4.9/5 (42)
Assume that a college student spends her income on books and pizza. The price of a pizza is $8, and the price of a book is $15. If she has $120 in income, she could choose to consume
(Multiple Choice)
4.9/5 (41)
Draw a budget constraint that is consistent with the following prices and income.
Income = 200
PY = 50
PX = 25
a. Demonstrate how your original budget constraint would change if income increases to 500.
b. Demonstrate how your original budget constraint would change if PY decreases to 20.
c. Demonstrate how your original budget constraint would change if PX increases to 40.
(Essay)
4.8/5 (34)
Figure 21-2
The downwardsloping line on the figure represents a consumer's budget constraint. 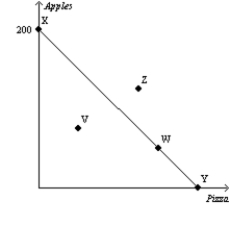 -Refer to Figure 21-2. Which of the following statements is correct?
(Multiple Choice)
4.7/5 (39)
Figure 21-30
The graph shows two budget constraints for a consumer. 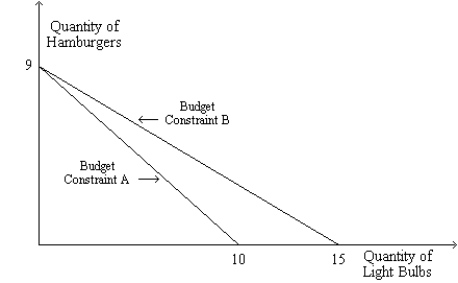 -Refer to Figure 21-30. Suppose the price of a light bulb is $3 and Budget Constraint B applies. What is the consumer's income? What is the price of a hamburger?
(Essay)
4.8/5 (38)
Figure 21-25
The figure pertains to a particular consumer. On the axes, X represents the quantity of good X and Y represents the quantity of good Y. 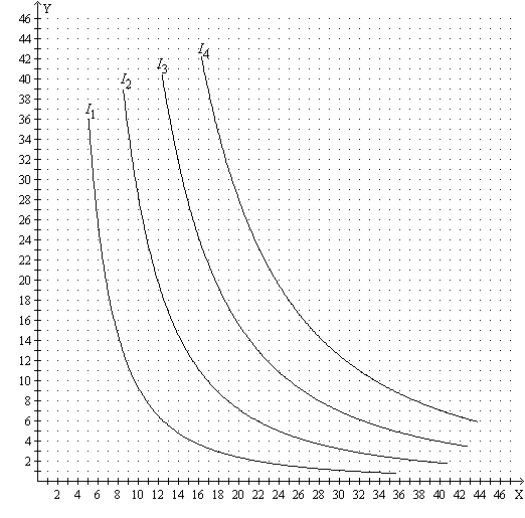 -Refer to Figure 21-25. The four curves that are drawn on the figure are
(Multiple Choice)
5.0/5 (31)
The income effect in the work-leisure model induces a person to work less in response to higher wages, which tends to make the labor-supply curve slope backward.
(True/False)
4.7/5 (41)
Which of the following examples would illustrate a backward-sloping labor supply-curve?
(Multiple Choice)
4.7/5 (37)
If Suzette responds to an increase in the interest rate by decreasing her saving, then, for Suzette,
(Multiple Choice)
4.7/5 (37)
The indifference curves for left gloves and right gloves are straight lines.
(True/False)
4.8/5 (31)
Figure 21-3
In each case, the budget constraint moves from BC-1 to BC-2.
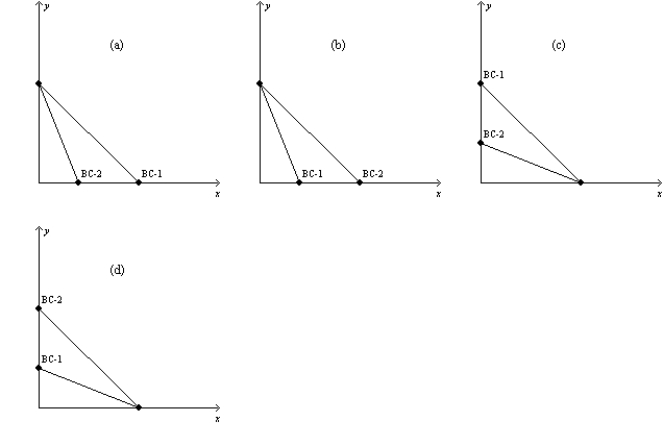 -Refer to Figure 21-3. Which of the graphs in the figure reflects a decrease in the price of good X only?
(Multiple Choice)
4.7/5 (38)
Figure 21-24
The figure shows three indifference curves and a budget constraint for a certain consumer named Steve. 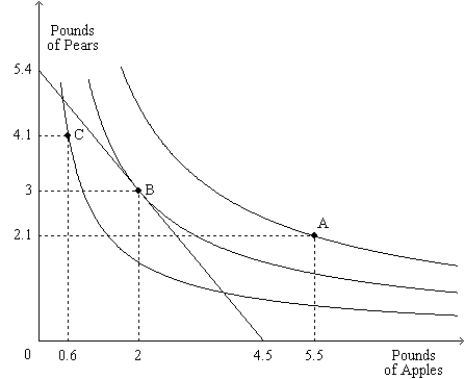 -Refer to Figure 21-24. In moving from point A to point C, Steve gives up
(Multiple Choice)
4.8/5 (34)
Suppose the only two goods that Charlie consumes are wine and cheese. When wine sells for $10 a bottle and cheese sell for $10 a pound, he buys 6 bottles of wine and 4 pounds of cheese - spending his entire income of $100. One day the price of wine falls to $5 a bottle and the price of cheese increases to $20 a pound, while his income does not change. The bundle of wine and cheese that he purchased at the old prices now costs
(Multiple Choice)
4.9/5 (40)
If the consumer's income and all prices simultaneously double, then the optimum consumption bundle will
(Multiple Choice)
4.8/5 (43)
Figure 21-19 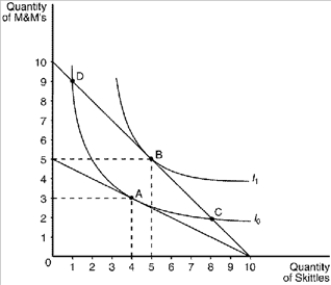 -Refer to Figure 21-19. Assume that the consumer depicted in the figure has an income of $20. The price of Skittles is $2 and the price of M&M's is $4. The consumer's optimal choice is point
(Multiple Choice)
4.8/5 (30)
Filters
- Essay(0)
- Multiple Choice(0)
- Short Answer(0)
- True False(0)
- Matching(0)