Exam 21: The Theory of Consumer Choice
Exam 1: Ten Principles of Economics439 Questions
Exam 2: Thinking Like an Economist617 Questions
Exam 3: Interdependence and the Gains From Trade527 Questions
Exam 4: The Market Forces of Supply and Demand698 Questions
Exam 5: Elasticity and Its Application595 Questions
Exam 6: Supply, Demand, and Government Policies644 Questions
Exam 7: Consumers, Producers, and the Efficiency of Markets549 Questions
Exam 8: Application: The Costs of Taxation511 Questions
Exam 9: Application: International Trade493 Questions
Exam 10: Externalities524 Questions
Exam 11: Public Goods and Common Resources433 Questions
Exam 12: The Design of the Tax System551 Questions
Exam 13: The Costs of Production420 Questions
Exam 14: Firms in Competitive Markets543 Questions
Exam 15: Monopoly637 Questions
Exam 16: Monopolistic Competition587 Questions
Exam 17: Oligopoly496 Questions
Exam 18: The Markets for the Factors of Production564 Questions
Exam 19: Earnings and Discrimination490 Questions
Exam 20: Income Inequality and Poverty457 Questions
Exam 21: The Theory of Consumer Choice440 Questions
Exam 22: Frontiers of Microeconomics441 Questions
Select questions type
Figure 21-32
The figure shows three indifference curves and a budget constraint for a consumer named Hannah. When young, Hannah works and earns income. When old, she is retired and earns no income. 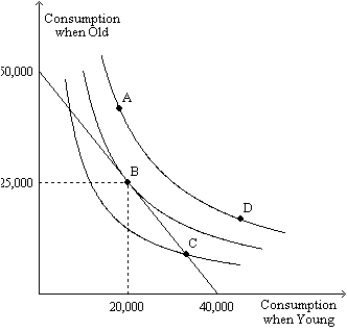 -Refer to Figure 21-32. Which of the four labeled points is Hannah's optimum?
(Short Answer)
4.9/5  (30)
(30)
Assume that a college student purchases only Ramen noodles and textbooks. If Ramen noodles are an inferior good and textbooks are a normal good, then the income effect associated with a decrease in the price of a textbook will result in
(Multiple Choice)
4.8/5 (36)
Assume that a college student purchases only Ramen noodles and textbooks. If Ramen noodles are an inferior good and textbooks are a normal good, then the income effect associated with an increase in the price of a textbook will result in
(Multiple Choice)
4.8/5 (35)
If we observe that Jamie's budget constraint has moved outward, then we know for certain that
(Multiple Choice)
5.0/5 (40)
Figure 21-3
In each case, the budget constraint moves from BC-1 to BC-2.
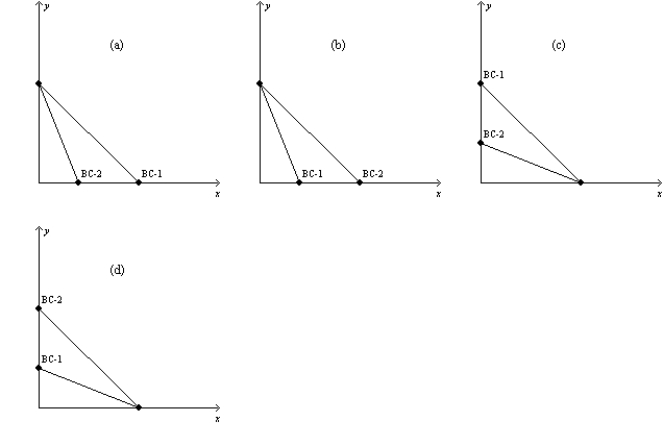 -Refer to Figure 21-3. Which of the graphs in the figure could reflect a simultaneous decrease in the price of good X and increase in the price of good Y? (i) graph a
(ii) graph b
(iii) graph c
(iv) graph d
-Refer to Figure 21-3. Which of the graphs in the figure could reflect a simultaneous decrease in the price of good X and increase in the price of good Y? (i) graph a
(ii) graph b
(iii) graph c
(iv) graph d
(Multiple Choice)
4.7/5 (34)
Figure 21-5
(a) (b)
 -Refer to Figure 21-5. In graph (a), what is the price of good X relative to the price of good Y (i.e., PX/PY)?
(Multiple Choice)
4.7/5 (40)
Figure 21-24
The figure shows three indifference curves and a budget constraint for a certain consumer named Steve. 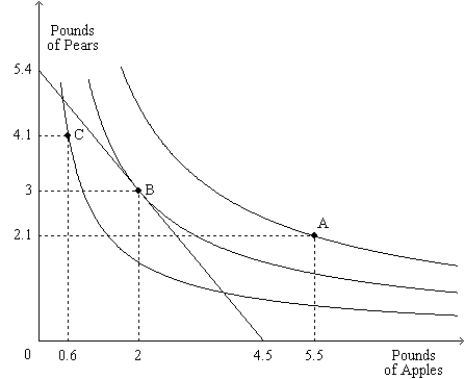 -Refer to Figure 21-24. If the price of a pound of pears is $3, then Steve's income is
(Multiple Choice)
4.9/5 (36)
Figure 21-23 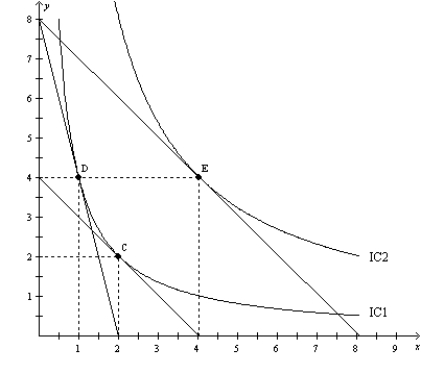 -Refer to Figure 21-23. When the price of X is $80, the price of Y is $20, and the consumer's income is $160, the consumer's optimal choice is D. Then the price of X decreases to $20. The income effect can be illustrated as the movement from
(Multiple Choice)
4.9/5 (45)
Figure 21-31
The figure shows two indifference curves and two budget constraints for a consumer named Kevin. 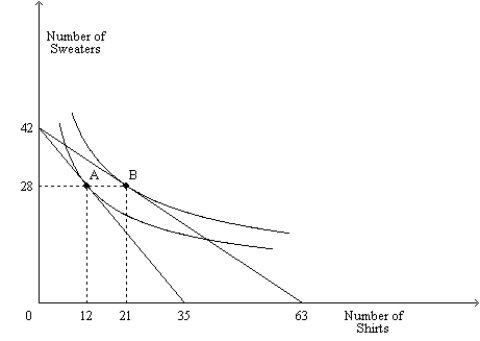 -Refer to Figure 21-31. Suppose Kevin is optimally purchasing 12 shirts and 28 sweaters, and he is spending $648 on shirts. What is the price of a sweater?
(Essay)
4.9/5 (38)
A good is an inferior good if the consumer buys less of it when
(Multiple Choice)
4.8/5 (43)
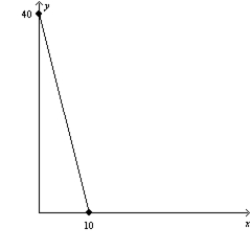
Figure 21-30
The graph shows two budget constraints for a consumer. 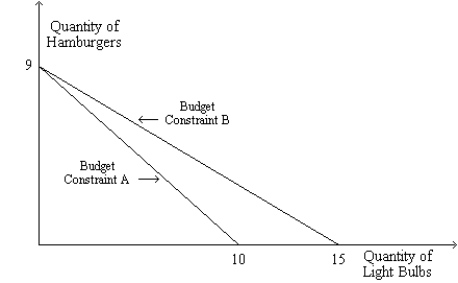 -Refer to Figure 21-30. Suppose the consumer's income is $90 and Budget Constraint A applies. What is the price of a light bulb?
(Short Answer)
4.9/5 (40)
Figure 21-3
In each case, the budget constraint moves from BC-1 to BC-2.
-Refer to Figure 21-3. Which of the graphs in the figure reflects a decrease in the price of good Y only?
(Multiple Choice)
4.9/5 (41)
What are the two effects of a change in a price that a consumer experiences?
(Multiple Choice)
4.8/5 (41)
Figure 21-20
The following graph illustrates a representative consumer's preferences for marshmallows and chocolate chip cookies: 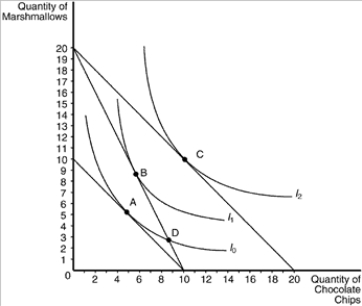 -Refer to Figure 21-20. Assume that the consumer depicted the figure has an income of $50. Based on the information available in the graph, which of the following price-quantity combinations would be on her demand curve for chocolate chips if the price of marshmallows is $2.50?
(Multiple Choice)
4.9/5 (34)
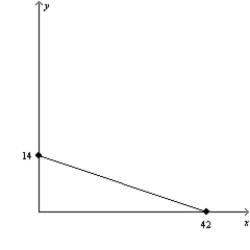
Figure 21-1
The downwardsloping line on the figure represents a consumer's budget constraint. 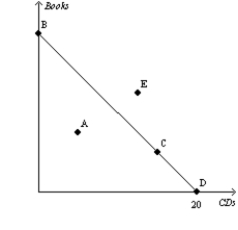 -Refer to Figure 21-1. If the price of a CD is $12, then the consumer's income amounts to
(Multiple Choice)
4.7/5 (28)
When a consumer spends less time enjoying leisure and more time working, she has
(Multiple Choice)
4.8/5 (50)
Giffen goods have positively-sloped demand curves because they are
(Multiple Choice)
4.8/5 (41)
A family on a trip budgets $1,000 for meals and gasoline. If the price of a meal for the family is $50 and if gasoline costs $3.50 per gallon, then how many meals can the family buy if they buy 100 gallons of gasoline?
(Multiple Choice)
4.9/5 (46)
Filters
- Essay(0)
- Multiple Choice(0)
- Short Answer(0)
- True False(0)
- Matching(0)