Exam 21: The Theory of Consumer Choice
Exam 1: Ten Principles of Economics439 Questions
Exam 2: Thinking Like an Economist617 Questions
Exam 3: Interdependence and the Gains From Trade527 Questions
Exam 4: The Market Forces of Supply and Demand698 Questions
Exam 5: Elasticity and Its Application595 Questions
Exam 6: Supply, Demand, and Government Policies644 Questions
Exam 7: Consumers, Producers, and the Efficiency of Markets549 Questions
Exam 8: Application: The Costs of Taxation511 Questions
Exam 9: Application: International Trade493 Questions
Exam 10: Externalities524 Questions
Exam 11: Public Goods and Common Resources433 Questions
Exam 12: The Design of the Tax System551 Questions
Exam 13: The Costs of Production420 Questions
Exam 14: Firms in Competitive Markets543 Questions
Exam 15: Monopoly637 Questions
Exam 16: Monopolistic Competition587 Questions
Exam 17: Oligopoly496 Questions
Exam 18: The Markets for the Factors of Production564 Questions
Exam 19: Earnings and Discrimination490 Questions
Exam 20: Income Inequality and Poverty457 Questions
Exam 21: The Theory of Consumer Choice440 Questions
Exam 22: Frontiers of Microeconomics441 Questions
Select questions type
Abby, Bobbi, and Deborah each buy ice cream and paperback novels to enjoy on hot summer days. Ice cream costs $5 per gallon, and paperback novels cost $8 each. Abby has a budget of $80, Bobbi has a budget of $60, and Deborah has a budget of $40 to spend on ice cream and paperback novels. Which of the following statements is correct?
(Multiple Choice)
4.8/5  (38)
(38)
If a consumer purchases more of good A when her income falls, good A is an inferior good.
(True/False)
5.0/5 (40)
When Stanley has an income of $1,000, he consumes 30 units of good A and 50 units of good B. After Stanley's income increases to $1,500, he consumes 60 units of good A and 45 units of good B. Which of the following statements is correct?
(Multiple Choice)
4.8/5 (38)
If Chad's laborsupply curve is upwardsloping, then, for Chad,
(Multiple Choice)
4.9/5 (35)
Figure 21-22 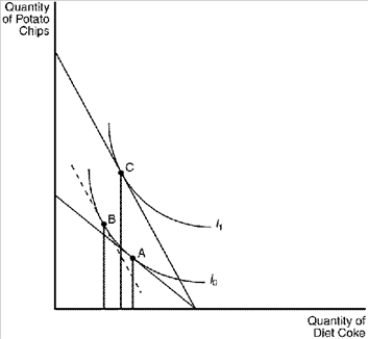 -Refer to Figure 21-22. If the consumer were initially at point A in the figure, a movement from point B to point C as a result of a decrease in the price of potato chips represents the
(Multiple Choice)
4.7/5 (33)
Scenario 21-3
Scott knows that he will ultimately face retirement. Assume that Scott will experience two periods in his life, one in which he works and earns income, and one in which he is retired and earns no income. Scott can earn $250,000 during his working period and nothing in his retirement period. He must both save and consume in his work period with an interest rate of 10 percent on savings.
-Refer to Scenario 21-3. Assume that Scott decides to consume $100,000 in the work period. How much money will he have available for consumption in his retirement period?
(Multiple Choice)
4.7/5 (42)
Figure 21-21 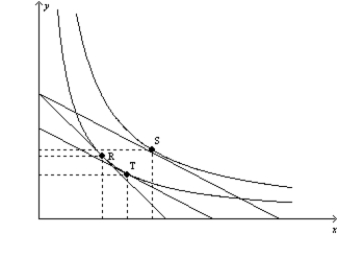 -Refer to Figure 21-21. Suppose that a consumer is originally at point R. Then the price of good X decreases. Which of the following represents the substitution effect of the price decrease?
(Multiple Choice)
4.9/5 (40)
When Jamar has an income of $2,000, he consumes 30 units of good A and 50 units of good B. After Jamar's income decreases to $1,500, he consumes 33 units of good A and 45 units of good B. Which of the following statements is correct?
(Multiple Choice)
4.9/5 (40)
Explain the difference between inferior and normal goods. As a developing economy experiences increases in income (measured by GDP), what would you predict to happen to demand for inferior goods?
(Essay)
4.8/5 (44)
Figure 21-8  -Refer to Figure 21-8. You have $300 to spend on good X and good Y. If good X costs $30 and good Y costs $50, your budget constraint is
(Multiple Choice)
4.7/5 (40)
Answer the following questions based on the table. A consumer is able to consume the following bundles of rice and beans when the price of rice is $2 and the price of beans is $3.
RICE BEANS
12 0
6 4
0 8
a. How much is this consumer's income?
b. Draw a budget constraint given this information. Label it B.
c. Construct a new budget constraint showing the change if the price of rice falls $1. Label this C.
d. Given the original prices for rice ($2) and beans ($3), construct a new budget constraint if this consumer's income increased to $48. Label this D.
(Essay)
4.8/5 (31)
Figure 21-20
The following graph illustrates a representative consumer's preferences for marshmallows and chocolate chip cookies: 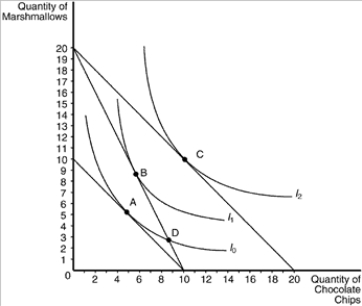 -Refer to Figure 21-20. Assume that the consumer has an income of $40. If the price of chocolate chips is $4 and the price of marshmallows is $4, the optimizing consumer would choose to purchase
(Multiple Choice)
4.9/5 (31)
Figure 21-4
In each case, the budget constraint moves from BC-1 to BC-2.
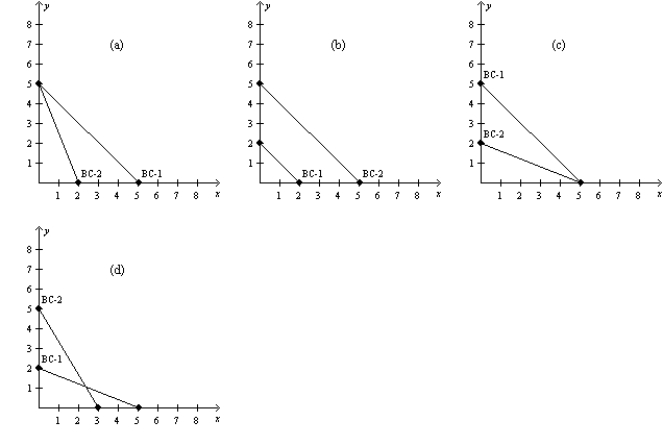 -Refer to Figure 21-4. Which of the graphs in the figure could reflect a simultaneous increase in the price of good X and decrease in the price of good Y?
(Multiple Choice)
4.9/5 (46)
Figure 21-25
The figure pertains to a particular consumer. On the axes, X represents the quantity of good X and Y represents the quantity of good Y.  -Refer to Figure 21-25. Suppose the price of good X is $15, the price of good Y is $10, and the consumer's income is $450. Then the consumer's optimal choice is to buy
(Multiple Choice)
4.9/5 (37)
Prince is currently consuming some of good X and some of good Y. If good Y is a normal good for Prince, then an increase in his income will definitely cause him to
(Multiple Choice)
4.9/5 (38)
Figure 21-6 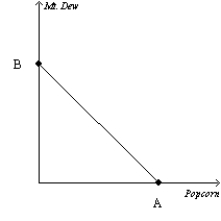 -Refer to Figure 21-6. Suppose the price of popcorn is $2, the price of Mt. Dew is $4, the value of A is 30, and the value of B is 15. How much income does the consumer have?
(Multiple Choice)
4.9/5 (47)
Figure 21-16 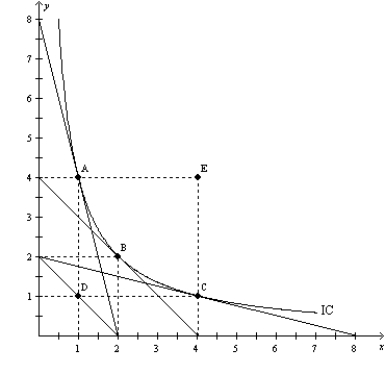 -Refer to Figure 21-16. The price of X is $5, the price of Y is $20, and the consumer's income is $40. Which point represents the consumer's optimal choice?
(Multiple Choice)
4.8/5 (43)
Figure 21-16
-Refer to Figure 21-16. The price of X is $25, the price of Y is $25, and the consumer's income is $100. Which point represents the consumer's optimal choice?
(Multiple Choice)
4.9/5 (30)
John is planning ahead for retirement in a two-period world. When John is young he will earn $1 million, and when John is old and retired he will be given $50,000 from Social Security. If the interest rate between the two time periods is 7 percent, what is the slope of John's budget constraint when considering the consumption possibilities between the two periods if consumption when young is graphed on the horizontal axis and consumption when old is graphed on the vertical axis?
(Multiple Choice)
5.0/5 (33)
Filters
- Essay(0)
- Multiple Choice(0)
- Short Answer(0)
- True False(0)
- Matching(0)