Exam 21: The Theory of Consumer Choice
Exam 1: Ten Principles of Economics439 Questions
Exam 2: Thinking Like an Economist617 Questions
Exam 3: Interdependence and the Gains From Trade527 Questions
Exam 4: The Market Forces of Supply and Demand698 Questions
Exam 5: Elasticity and Its Application595 Questions
Exam 6: Supply, Demand, and Government Policies644 Questions
Exam 7: Consumers, Producers, and the Efficiency of Markets549 Questions
Exam 8: Application: The Costs of Taxation511 Questions
Exam 9: Application: International Trade493 Questions
Exam 10: Externalities524 Questions
Exam 11: Public Goods and Common Resources433 Questions
Exam 12: The Design of the Tax System551 Questions
Exam 13: The Costs of Production420 Questions
Exam 14: Firms in Competitive Markets543 Questions
Exam 15: Monopoly637 Questions
Exam 16: Monopolistic Competition587 Questions
Exam 17: Oligopoly496 Questions
Exam 18: The Markets for the Factors of Production564 Questions
Exam 19: Earnings and Discrimination490 Questions
Exam 20: Income Inequality and Poverty457 Questions
Exam 21: The Theory of Consumer Choice440 Questions
Exam 22: Frontiers of Microeconomics441 Questions
Select questions type
Michael faces tradeoffs between consuming in the current period when he is young and consuming in a future period when he is old. Michael experiences a decrease in the current interest rate he earns on his savings. Michael will save
(Multiple Choice)
4.7/5  (46)
(46)
Figure 21-2
The downwardsloping line on the figure represents a consumer's budget constraint. 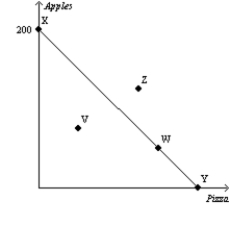 -Refer to Figure 21-2. Which of the following statements is not correct?
(Multiple Choice)
4.8/5 (33)
The marginal rate of substitution is the slope of the indifference curve.
(True/False)
4.7/5 (36)
An optimizing consumer will select the consumption bundle in which the marginal rate of substitution
(Multiple Choice)
4.9/5 (38)
The two "goods" used when economists analyze labor supply are
(Multiple Choice)
4.8/5 (40)
For Brent, the income effect of a wage increase is stronger than the substitution effect. In response to a wage increase, will Brent work more hours or will he work fewer hours?
(Essay)
4.7/5 (39)
A consumer's budget constraint is drawn on a graph with the number of sandwiches measured along the horizontal axis and the number of bowls of soup measured along the vertical axis. Hold the consumer's income and the price of a sandwich fixed, and increase the price of a bowl of soup. Describe the effect on the budget constraint.
(Essay)
4.8/5 (29)
Scenario 21-4 Frank spends all of his income of $240 per month on shirts and hats. The price of a shirt is $40 and the price of a hat is $30.
-Refer to Scenario 21-4. If Frank buys 3 shirts during a certain month, then how many hats does he buy during that month?
(Short Answer)
4.7/5 (26)
Figure 21-19 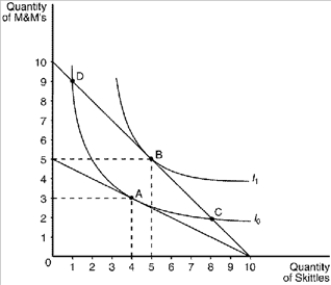 -Refer to Figure 21-19. Assume that the consumer depicted in the figure has an income of $20. The price of Skittles is $2 and the price of M&M's is $4. The consumer will choose a consumption bundle where the marginal rate of substitution is
(Multiple Choice)
4.8/5 (41)
When a consumer is purchasing the best combination of two goods, X and Y, subject to a budget constraint, we say that the consumer is at an optimal choice point. A graph of an optimal choice point shows that it occurs
(Multiple Choice)
4.9/5 (37)
A field experiment conducted by economists in the Chinese province of Hunan provided evidence that, for poor households in that province, rice is a good.
(Short Answer)
4.9/5 (36)
Figure 21-31
The figure shows two indifference curves and two budget constraints for a consumer named Kevin. 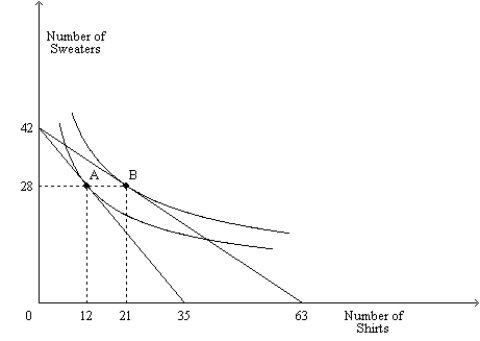 -Refer to Figure 21-31. If point B is Kevin's optimum, then at that optimum, what is his opportunity cost of a sweater in terms of shirts?
(Essay)
4.8/5 (36)
Figure 21-25
The figure pertains to a particular consumer. On the axes, X represents the quantity of good X and Y represents the quantity of good Y. 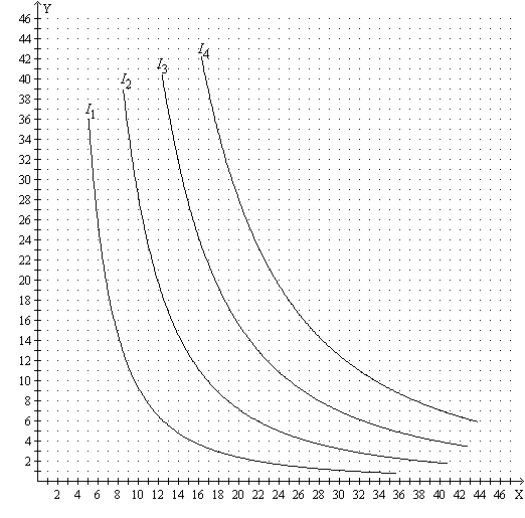 -Refer to Figure 21-25. Suppose the price of good X is $15, the price of good Y is $10, and the consumer's income is $450. Then the consumer's optimal choice is represented by a point on which curve?
(Multiple Choice)
4.9/5 (40)
Figure 21-17 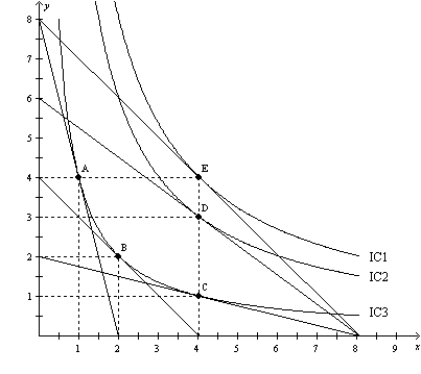 -Refer to Figure 21-17. When the price of X is $40, the price of Y is $40, and income is $160, Paul's optimal choice is point B. Then Paul's income increases to $320, and his optimal choice is point E. For Paul,
(Multiple Choice)
4.9/5 (31)
Figure 21-25
The figure pertains to a particular consumer. On the axes, X represents the quantity of good X and Y represents the quantity of good Y.
-Refer to Figure 21-25. Suppose the price of good X is $8, the price of good Y is $10, and the consumer's income is $360. Then the consumer's optimal choice is represented by a point on which curve?
(Multiple Choice)
4.9/5 (39)
Figure 21-19
-Refer to Figure 21-19. Assume that the consumer depicted in the figure has an income of $50. The price of Skittles is $5 and the price of M&M's is $5. This consumer will choose a consumption bundle where the marginal rate of substitution is
(Multiple Choice)
5.0/5 (44)
When we draw Katie's indifference curves to represent her preferences for books and movies, we find that her indifference curves are upward-sloping. What does this tell us about Katie's preferences?
(Essay)
4.8/5 (35)
Filters
- Essay(0)
- Multiple Choice(0)
- Short Answer(0)
- True False(0)
- Matching(0)