Exam 19: Data Analysis: Analyzing Individual Variables and Basics of Hypothesis Testing
Exam 1: The Role of Marketing Research50 Questions
Exam 2: Gathering Marketing Intelligence: The Systems Approach71 Questions
Exam 3: Gathering Marketing Intelligence: The Project Approach54 Questions
Exam 4: Problem Formulation45 Questions
Exam 5: Types of Research Design and Exploratory Research100 Questions
Exam 6: Descriptive and Causal Research Designs108 Questions
Exam 7: Secondary Data56 Questions
Exam 8: Standardized Marketing Information Services45 Questions
Exam 9: Collecting Primary Data52 Questions
Exam 10: Collecting Information by Communication66 Questions
Exam 11: Collecting Information by Observation48 Questions
Exam 12: Asking Good Questions: Measurement Basics98 Questions
Exam 13: Measuring Attitudes and Other Variables66 Questions
Exam 14: Designing the Questionnaire or Observation Form105 Questions
Exam 15: Developing the Sampling Plan115 Questions
Exam 16: Determining Sample Size63 Questions
Exam 17: Collecting the Data: Nonsampling Errors and Response Rate Calculation111 Questions
Exam 18: Data Analysis: Preliminary Steps52 Questions
Exam 19: Data Analysis: Analyzing Individual Variables and Basics of Hypothesis Testing79 Questions
Exam 20: Data Analysis: Analyzing Multiple Variables Simultaneously88 Questions
Exam 21: The Research Report78 Questions
Select questions type
The FactFinder Research firm conducted a survey for a national food manufacturer and one of the issues addressed by the research was to determine how many pounds of fish were annually consumed per capita.In the survey they found one person who consumed only one pound of fish per year while 10 people reported 200 pounds per year.The range was
(Multiple Choice)
4.8/5  (31)
(31)
In the following data set,what is the median? 12,0,0,1,1,1,6,10,11.
(Multiple Choice)
5.0/5 (42)
Which of the following statements concerning confidence intervals is FALSE?
(Multiple Choice)
4.7/5 (28)
Suppose that a random sample of 550 new car owners found that 38 percent of them were aware of a particular brand of tires that your company sells.If you are willing to accept less than a 5 percent chance of error that the true awareness rate of your company's brand of tire across all new car owners is less than 0.45,which statistical technique should you use from this data?
(Multiple Choice)
4.9/5 (34)
The more confidence we want to have in the interval estimate,the larger the sample size should be.
(True/False)
4.7/5 (34)
Descriptive statistics include all of the following measures EXCEPT
(Multiple Choice)
4.8/5 (43)
The chi-square test is an approximate test.The approximation is relatively good if the
(Multiple Choice)
4.8/5 (31)
Exhibit 19.6 120 field mice are weighed.The average weight of a mouse is 225 grams and the sample standard deviation is 15.1 grams.
Refer to Exhibit 19.6.What is the estimated standard error of the mean?
(Multiple Choice)
4.9/5 (37)
A researcher determines a sample of size (n)100 is necessary to estimate a population mean with 95% confidence (z = 2).The calculation of sample size required that he estimate the population standard deviation since it was unknown,and he estimated it as 150.The 100 observations produced a sample mean 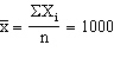 and a sample standard deviation
 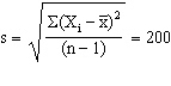 The resulting confidence interval is
(Multiple Choice)
4.9/5 (39)
Exhibit 19.6 120 field mice are weighed.The average weight of a mouse is 225 grams and the sample standard deviation is 15.1 grams.
Refer to Exhibit 19.6.What is the value of the test statistic for the hypothesis that the actual mean weight of the mouse population is greater than 235 grams?
(Multiple Choice)
4.8/5 (37)
Which of the following is FALSE about the use of percentages when reporting results?
(Multiple Choice)
4.9/5 (31)
Which of the following statements if FALSE concerning the conversion of continuous measures to categorical measures?
(Multiple Choice)
4.8/5 (35)
Exhibit 19.5  Refer to Exhibit 19.5.The appropriate test statistic for this problem would be a
(Multiple Choice)
4.8/5 (19)
A(n)____________________ interval is a projection of the range within which a population parameter will lie at a given level of confidence based on a statistic obtained from an appropriately drawn sample.
(Short Answer)
4.8/5 (37)
A statistical test to determine whether some observed pattern of frequencies corresponds to an expected pattern is called a chi-square goodness-of-fit test.
(True/False)
4.8/5 (41)
An outlier is an observation so different from the rest of the observations that the analyst chooses to treat it as a special case.
(True/False)
4.8/5 (33)
When a sample mean is compared against a standard for a large sample,which statistic is calculated?
(Multiple Choice)
4.9/5 (34)
A researcher had calculated the sample chi-square test statistic to be equal to c2 = 7.71.For an alpha level of 0.10 and 4 degrees of freedom,the critical value of the chi-square statistic is 7.78.The appropriate conclusion is that the
(Multiple Choice)
4.8/5 (31)
Filters
- Essay(0)
- Multiple Choice(0)
- Short Answer(0)
- True False(0)
- Matching(0)