Exam 19: Data Analysis: Analyzing Individual Variables and Basics of Hypothesis Testing
Exam 1: The Role of Marketing Research50 Questions
Exam 2: Gathering Marketing Intelligence: The Systems Approach71 Questions
Exam 3: Gathering Marketing Intelligence: The Project Approach54 Questions
Exam 4: Problem Formulation45 Questions
Exam 5: Types of Research Design and Exploratory Research100 Questions
Exam 6: Descriptive and Causal Research Designs108 Questions
Exam 7: Secondary Data56 Questions
Exam 8: Standardized Marketing Information Services45 Questions
Exam 9: Collecting Primary Data52 Questions
Exam 10: Collecting Information by Communication66 Questions
Exam 11: Collecting Information by Observation48 Questions
Exam 12: Asking Good Questions: Measurement Basics98 Questions
Exam 13: Measuring Attitudes and Other Variables66 Questions
Exam 14: Designing the Questionnaire or Observation Form105 Questions
Exam 15: Developing the Sampling Plan115 Questions
Exam 16: Determining Sample Size63 Questions
Exam 17: Collecting the Data: Nonsampling Errors and Response Rate Calculation111 Questions
Exam 18: Data Analysis: Preliminary Steps52 Questions
Exam 19: Data Analysis: Analyzing Individual Variables and Basics of Hypothesis Testing79 Questions
Exam 20: Data Analysis: Analyzing Multiple Variables Simultaneously88 Questions
Exam 21: The Research Report78 Questions
Select questions type
A research study that tests the hypothesis,"The population mean household income in the new market area is greater than $29,000," will involve a
(Multiple Choice)
4.8/5  (34)
(34)
The hypothesis that a proposed result is not true for the population is called the ____________________ hypothesis.
(Short Answer)
4.8/5 (31)
Data analysis hinges on which of the following considerations about the variable(s)to be analyzed?
(Multiple Choice)
4.9/5 (36)
Which of the following statements concerning the sample standard deviation is FALSE?
(Multiple Choice)
4.8/5 (29)
A histogram is a form of bar chart that is based on information from a frequency count.
(True/False)
4.8/5 (31)
You can "prove" that the alternative hypothesis is true if the null hypothesis is rejected.
(True/False)
4.8/5 (37)
Exhibit 19.2  Refer to Exhibit 19.2.What is the average number of televisions per household?
(Multiple Choice)
4.7/5 (36)
Kit Kat candy bar executives make the following statement: "Our most likely estimate of Kit Kat's ad recall rate is 65%.In addition,we are 95% confident that Kit Kat's ad recall rate in the population falls between 62% and 68%." This illustrates an example of
(Multiple Choice)
4.9/5 (38)
Which of the following would NOT be an example of a situation involving univariate analysis?
(Multiple Choice)
4.9/5 (35)
Which type of statistical analysis would we use to determine if female college graduates' starting salary was different from their male counterpart (assuming data is collected using the following question on the survey "What is your starting salary ____?"
(Multiple Choice)
4.7/5 (30)
In using percentages for reporting results it is reasonable to report percentages to two decimal places.
(True/False)
4.9/5 (29)
Which of the following statements is FALSE? The t-test to test a hypothesis about a single population mean
(Multiple Choice)
4.8/5 (35)
Exhibit 19.1 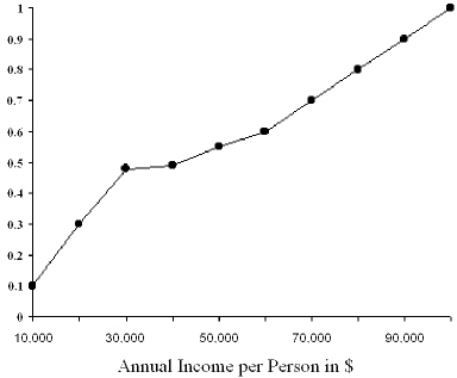 Refer to Exhibit 19.1.$50,000 represents the ____ in the figure above.
(Multiple Choice)
4.7/5 (37)
The ____________________ is a statistical test to determine whether some observed pattern of frequencies corresponds to and expected pattern.
(Short Answer)
4.7/5 (32)
Exhibit 19.1  Refer to Exhibit 19.1.The figure above is an example of a
(Multiple Choice)
4.9/5 (32)
An analyst is interested in testing the hypothesis Ho: m £ 15000.The data consist of 20 observations of an intervally scaled variable which is normally distributed,but with unknown variance.The correct statistical procedure is
(Multiple Choice)
4.9/5 (45)
A sampling procedure is statistically more efficient than another procedure if,for a given sample size,it results in a larger sampling error.
(True/False)
4.8/5 (37)
Filters
- Essay(0)
- Multiple Choice(0)
- Short Answer(0)
- True False(0)
- Matching(0)