Exam 4: Supply and Demand: An Initial Look
Exam 1: What Is Economics227 Questions
Exam 2: The Economy: Myth and Reality150 Questions
Exam 3: The Fundamental Economic Problem: Scarcity and Choice250 Questions
Exam 4: Supply and Demand: An Initial Look308 Questions
Exam 5: Consumer Choice: Individual and Market Demand202 Questions
Exam 6: Demand and Elasticity207 Questions
Exam 7: Production,Inputs,and Cost: Building Blocks for Supply Analysis215 Questions
Exam 8: Output,Price,and Profit: The Importance of Marginal Analysis189 Questions
Exam 9: Securities: Business Finance,and the Economy: The Tail That Wags the Dog198 Questions
Exam 10: The Firm and the Industry Under Perfect Competition206 Questions
Exam 11: Monopoly204 Questions
Exam 12: Between Competition and Monopoly225 Questions
Exam 13: Limiting Market Power: Regulation and Antitrust152 Questions
Exam 14: The Case for Free Markets I: the Price System219 Questions
Exam 15: The Shortcomings of Free Markets214 Questions
Exam 16: The Markets Prime Achievement: Innovation and Growth110 Questions
Exam 17: Externalities, the Environment, and Natural Resources217 Questions
Exam 18: Taxation and Resource Allocation219 Questions
Exam 19: Pricing the Factors of Production228 Questions
Exam 20: Labor and Entrepreneurship: The Human Inputs222 Questions
Exam 21: Poverty, Inequality, and Discrimination167 Questions
Exam 22: International Trade and Comparative Advantage226 Questions
Select questions type
Black-market prices are below equilibrium prices because sellers want to sell large quantities.
(True/False)
5.0/5  (43)
(43)
Price controls usually enhance efficiency in the allocation of resources.
(True/False)
4.9/5 (32)
As more firms are attracted to an industry,the supply curve can be expected to shift to the right.
(True/False)
4.9/5 (33)
At equilibrium,the market will clear,with no surpluses or shortages occurring.
(True/False)
4.9/5 (45)
Assuming that resources are specialized,the opportunity cost of an item increases as production of it rises.Therefore,we expect that firms will produce more if
(Multiple Choice)
4.9/5 (33)
The price of one good produced by a multiproduct industry rises.For another good produced by that industry
(Multiple Choice)
4.7/5 (41)
Figure 4-5
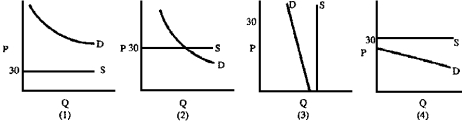 -If the suppliers of a good will sell any amount at $30 but there are no sales,then the market can best be represented by which graph in Figure 4-5?
(Multiple Choice)
4.7/5 (47)
Figure 4-4
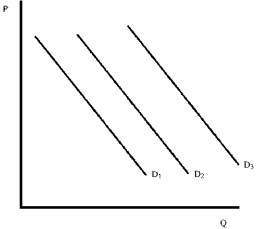 -Assume that Figure 4-4 shows demand for soda.A decrease in the price of apple juice will change demand from
(Multiple Choice)
4.8/5 (35)
Draw a graph of a market in equilibrium.Describe what might cause a change in demand or supply and how this would affect the diagram.Indicate how the equilibrium price and quantity will change.
(Essay)
4.9/5 (40)
Figure 4-4
-Assume that Figure 4-4 shows demand for MP3 players.An increase in the price of music downloads changes demand from
(Multiple Choice)
4.8/5 (34)
Table 4-1
Use this table for the following questions.
Quantity Quantity Price Demanded Supplied \ 10 1,000 5,500 9 2,000 5,000 8 3,000 4,500 7 4,000 4,000 6 5,000 3,500 5 6,000 3,000 4 7,000 2,500 3 8,000 2,000 2 9,000 1,500 1 10,000 1,000
-Refer to Table 4-1.What is the equilibrium price in the example above?
(Multiple Choice)
4.8/5 (39)
Assume a new technology further reduces the cost of producing calculators.Also assume that consumers have cut back on their scheduled purchases in anticipation of even more cost-saving developments.As a result,we can expect
(Multiple Choice)
4.8/5 (40)
Filters
- Essay(0)
- Multiple Choice(0)
- Short Answer(0)
- True False(0)
- Matching(0)