Exam 4: Supply and Demand: An Initial Look
Exam 1: What Is Economics227 Questions
Exam 2: The Economy: Myth and Reality150 Questions
Exam 3: The Fundamental Economic Problem: Scarcity and Choice250 Questions
Exam 4: Supply and Demand: An Initial Look308 Questions
Exam 5: Consumer Choice: Individual and Market Demand202 Questions
Exam 6: Demand and Elasticity207 Questions
Exam 7: Production,Inputs,and Cost: Building Blocks for Supply Analysis215 Questions
Exam 8: Output,Price,and Profit: The Importance of Marginal Analysis189 Questions
Exam 9: Securities: Business Finance,and the Economy: The Tail That Wags the Dog198 Questions
Exam 10: The Firm and the Industry Under Perfect Competition206 Questions
Exam 11: Monopoly204 Questions
Exam 12: Between Competition and Monopoly225 Questions
Exam 13: Limiting Market Power: Regulation and Antitrust152 Questions
Exam 14: The Case for Free Markets I: the Price System219 Questions
Exam 15: The Shortcomings of Free Markets214 Questions
Exam 16: The Markets Prime Achievement: Innovation and Growth110 Questions
Exam 17: Externalities, the Environment, and Natural Resources217 Questions
Exam 18: Taxation and Resource Allocation219 Questions
Exam 19: Pricing the Factors of Production228 Questions
Exam 20: Labor and Entrepreneurship: The Human Inputs222 Questions
Exam 21: Poverty, Inequality, and Discrimination167 Questions
Exam 22: International Trade and Comparative Advantage226 Questions
Select questions type
If the supply curve for housing has the normal positive slope,rent controls will likely
(Multiple Choice)
4.8/5  (34)
(34)
Consumers expressed outrage at the high price of chainsaws after Hurricane Andrew hit Florida and Louisiana,with newspaper editorials accusing suppliers of unconscionable price gouging.Use a supply and demand graph to assist in explaining the increase in the price of chain saws after Hurricane Andrew.
(Essay)
4.9/5 (51)
Which of the following would cause an increase in demand for Toyota automobiles?
(Multiple Choice)
4.9/5 (38)
Equilibrium is reached where there is no inherent force causing quantity supplied or quantity demanded to change.
(True/False)
4.9/5 (43)
Figure 4-23
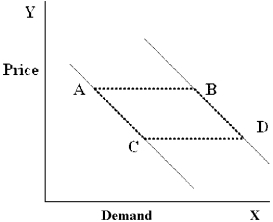 -In Figure 4-23,which movement will be caused by changes in income?
(Multiple Choice)
4.8/5 (36)
What is the economic reasoning behind the proposal to legalize drugs?
(Multiple Choice)
4.8/5 (35)
Which of the following will tend to occur if price controls are imposed on a product?
(Multiple Choice)
4.7/5 (43)
Figure 4-13
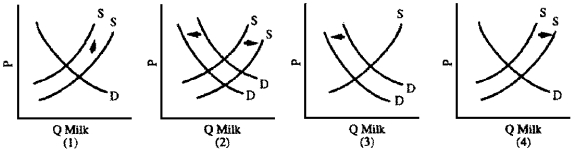 -The drug BGH (bovine growth hormone)dramatically increases the milk output of dairy cows.Farmers in Wisconsin,a big dairy state,vigorously oppose licensing the drug,fearing that excess supply and a consumer reaction on the purity of food issue will put many of them out of business.Which graph in Figure 4-13 best illustrates the farmers' fears?
(Multiple Choice)
4.8/5 (33)
Figure 4-12
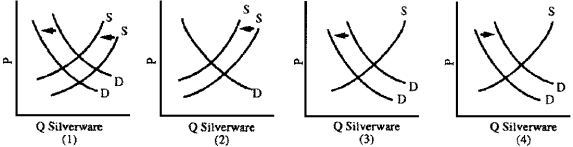 -The silverware industry has been in serious decline since the 1980s.Family dining habits are less formal so people purchase less silverware.Also,in 2006-2008,the price of silver increased from $5 to $20 per ounce.Which graph in Figure 4-12 best illustrates these developments?
(Multiple Choice)
4.8/5 (42)
Figure 4-3
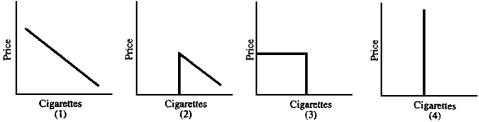 -A 1985 Harvard study showed that the price of cigarettes does not affect how much an individual smokes but whether he smokes.If this is correct,which graph in Figure 4-3 shows the typical individual's demand curve for cigarettes?
(Multiple Choice)
4.8/5 (44)
The demand curve for a good connects points describing how much consumers
(Multiple Choice)
4.8/5 (37)
Show graphically the effect of technological advance on the price of music downloads.In a separate graph show what happens to the price of CDs as a secondary effect of the new download technology.
(Essay)
4.8/5 (35)
Exhibit 4-1
The following are the equations for the supply and demand curves in the market for weezils:
Demand =20-2F Supply: =5+3
where Qd is the quantity demanded, Qs is the quantity supplied, and P is the price per weezil in dollars.
-Refer to Exhibit 4-1.According to the data given,when the market is in Equilibrium,how many weezils are sold?
(Multiple Choice)
4.8/5 (30)
Distinguish between demand and quantity demanded.Do the same for supply and quantity supplied.
(Essay)
4.8/5 (34)
Suppose demand can be described with the equation Q = 900 - 5P and supply with the equation Q = 100 + 5P.Complete the following table.Determine the equilibrium price and quantity.
Quantity Quantity Surplus/ Price Demanded Supplied Shortage \ 100 --- --- --- 95 --- --- --- 90 --- --- --- 85 --- --- --- 80 --- --- --- 75 --- --- --- 70 --- --- --- 65 --- --- --- 60 --- --- ---
(Essay)
4.9/5 (30)
The imposition of price ceilings on a market often results in
(Multiple Choice)
4.8/5 (42)
Filters
- Essay(0)
- Multiple Choice(0)
- Short Answer(0)
- True False(0)
- Matching(0)