Exam 5: Pearson Correlation and Regression: Descriptive Aspects
Exam 1: Introduction and Mathematical Preliminaries146 Questions
Exam 2: Frequency and Probability Distributions150 Questions
Exam 3: Measures of Central Tendency and Variability154 Questions
Exam 4: Percentiles,percentile Ranks,standard Scores,and the Normal Distribution176 Questions
Exam 5: Pearson Correlation and Regression: Descriptive Aspects152 Questions
Exam 6: Probability149 Questions
Exam 7: Estimation and Sampling Distributions151 Questions
Exam 8: Hypothesis Testing: Inferences About a Single Mean160 Questions
Exam 9: Principles of Research Design and Statistical Preliminaries for Analyzing Bivariate Relationships150 Questions
Exam 10: Independent Groups T-Test149 Questions
Exam 11: Correlated Groups T-Test125 Questions
Exam 12: One-Way Repeated Measures Analysis of Variance140 Questions
Exam 13: Pearson Correlation and Regression: Inferential Aspects143 Questions
Exam 14: Chi-Square Test145 Questions
Exam 15: Nonparametric Statistics135 Questions
Exam 16: Two-Way Between-Subjects Analysis of Variance117 Questions
Exam 17: Overview and Extension: Statistical Tests for More Complex Designs124 Questions
Select questions type
A sum of squares indicates the extent to which two sets of scores vary from one another,or covary.
Free
(True/False)
4.8/5  (35)
(35)
Correct Answer: Verified
False
The point at which a line intersects the Y axis when X = 1.0 is called the intercept.
Free
(True/False)
4.8/5 (32)
Correct Answer:Verified
False
The ____________________ minimizes the sum of the squared discrepancies between the predicted and observed Y scores.
Free
(Short Answer)
4.8/5 (32)
Correct Answer:Verified
least squares criterion
For a perfect positive linear relationship,the z scores for the X and Y variables will tend to have _____.
(Multiple Choice)
4.7/5 (30)
Refer to the following data set.
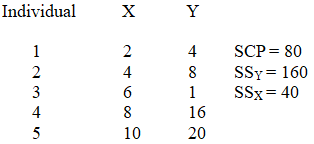 The standard error of estimate is _______.
(Multiple Choice)
4.9/5 (35)
Which correlation coefficient most closely represents the relationship depicted in the scatterplot below? 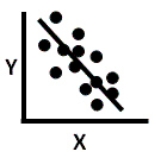
(Multiple Choice)
5.0/5 (31)
The largest correlation coefficient that can be observed under any circumstance is _____.
(Multiple Choice)
4.8/5 (34)
The extent of _____ between two variables is indexed by a statistic known as the Pearson correlation coefficient.
(Multiple Choice)
4.8/5 (42)
If X helps to predict Y,then the standard deviation of Y _____.
(Multiple Choice)
4.9/5 (35)
The _____ represents the average error across individuals in predicting scores on Y from the regression equation.
(Multiple Choice)
4.8/5 (26)
When standard scores are used to calculate the regression equation,the intercept will always equal _____ and the slope will always equal _____.
(Multiple Choice)
4.9/5 (36)
The fact that there is a positive relationship between the murder rate and ice cream consumption can be explained by the fact that both of these increase during hot weather.This is an example of a _____.
(Multiple Choice)
4.7/5 (31)
The regression equation for predicting X from Y is the same as the regression equation for predicting Y from X.
(True/False)
4.8/5 (37)
Explain why a correlation between two variables does not necessarily imply that one variable causes the other to vary as it does.
(Essay)
4.8/5 (32)
When a correlation is perfect and positive,which of the following holds true?
(Multiple Choice)
4.9/5 (42)
When one finds that there is a strong correlation between X and Y it is possible that.....
(Multiple Choice)
4.9/5 (32)
Filters
- Essay(0)
- Multiple Choice(0)
- Short Answer(0)
- True False(0)
- Matching(0)