Exam 5: Pearson Correlation and Regression: Descriptive Aspects
Exam 1: Introduction and Mathematical Preliminaries146 Questions
Exam 2: Frequency and Probability Distributions150 Questions
Exam 3: Measures of Central Tendency and Variability154 Questions
Exam 4: Percentiles,percentile Ranks,standard Scores,and the Normal Distribution176 Questions
Exam 5: Pearson Correlation and Regression: Descriptive Aspects152 Questions
Exam 6: Probability149 Questions
Exam 7: Estimation and Sampling Distributions151 Questions
Exam 8: Hypothesis Testing: Inferences About a Single Mean160 Questions
Exam 9: Principles of Research Design and Statistical Preliminaries for Analyzing Bivariate Relationships150 Questions
Exam 10: Independent Groups T-Test149 Questions
Exam 11: Correlated Groups T-Test125 Questions
Exam 12: One-Way Repeated Measures Analysis of Variance140 Questions
Exam 13: Pearson Correlation and Regression: Inferential Aspects143 Questions
Exam 14: Chi-Square Test145 Questions
Exam 15: Nonparametric Statistics135 Questions
Exam 16: Two-Way Between-Subjects Analysis of Variance117 Questions
Exam 17: Overview and Extension: Statistical Tests for More Complex Designs124 Questions
Select questions type
From a conceptual perspective,the tradition is to designate the independent variable as the _____ variable and the dependent variable as the _____ variable.
(Multiple Choice)
4.8/5  (37)
(37)
In least squares analysis,the slope and intercept are defined so as to minimize the _____ that the data points,considered collectively,are from the regression line.
(Multiple Choice)
4.8/5 (36)
Define the standard error of estimate and discuss how it is interpreted.
(Essay)
4.9/5 (34)
The __________ indicates the number of units variable Y changes as variable X changes by 1 unit.
(Multiple Choice)
4.8/5 (37)
Which type of relationship is graphed in the following scatterplot? 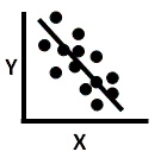
(Multiple Choice)
4.9/5 (35)
If the value of variables X and Y are inversely related,then as a score on X ____ the value of a score on Y ____.
(Multiple Choice)
4.8/5 (40)
Refer to the following data set.
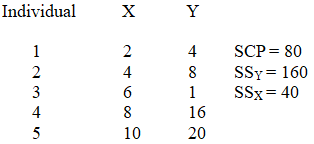 The regression equation for the prediction of Y values is _____.
(Multiple Choice)
4.9/5 (29)
Pearson correlation and regression can be used to determine the extent to which a data set approximates a ____________________ relationship.
(Short Answer)
4.8/5 (41)
Pearson correlation will detect linear and nonlinear relationships.
(True/False)
4.9/5 (45)
The magnitude of the correlation coefficient is indexed by its:
(Multiple Choice)
4.8/5 (36)
Which of the following linear relationships describes a situation in which the value of one variable increases as the value of the second variable decreases?
(Multiple Choice)
4.7/5 (39)
Which of the following linear relationships describes a situation in which the value of one variable decreases as the value of the second variable also decreases?
(Multiple Choice)
4.7/5 (36)
Which of the following r values indicates the weakest relationship between two variables?
(Multiple Choice)
4.8/5 (30)
If two variables are related in a fashion that is nonlinear,Pearson correlation:
(Multiple Choice)
4.8/5 (30)
The absolute magnitude of the standard error of the estimate is not meaningful.
(True/False)
4.9/5 (25)
Which correlation coefficient most closely represents the relationship depicted in the scatterplot below? 
(Multiple Choice)
4.8/5 (32)
Which type of relationship is graphed in the following scatterplot? 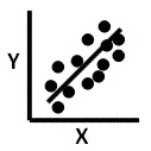
(Multiple Choice)
4.8/5 (36)
Outliers are most likely to produce misleading results when:
(Multiple Choice)
4.9/5 (41)
Filters
- Essay(0)
- Multiple Choice(0)
- Short Answer(0)
- True False(0)
- Matching(0)