Exam 5: Pearson Correlation and Regression: Descriptive Aspects
Exam 1: Introduction and Mathematical Preliminaries146 Questions
Exam 2: Frequency and Probability Distributions150 Questions
Exam 4: Percentiles percentile Ranks standard Scores and the Normal Distribution176 Questions
Exam 5: Pearson Correlation and Regression: Descriptive Aspects152 Questions
Exam 3: Measures of Central Tendency and Variability154 Questions
Exam 7: Estimation and Sampling Distributions151 Questions
Exam 8: Hypothesis Testing: Inferences About a Single Mean160 Questions
Exam 6: Probability149 Questions
Exam 9: Principles of Research Design and Statistical Preliminaries for Analyzing Bivariate Relationships150 Questions
Exam 10: Independent Groups T -Test149 Questions
Exam 11: Correlated Groups T-Test125 Questions
Exam 13: One-Way Repeated Measures Analysis of Variance140 Questions
Exam 14: Pearson Correlation and Regression: Inferential Aspects143 Questions
Exam 15: Chi-Square Test145 Questions
Exam 16: Nonparametric Statistics135 Questions
Exam 17: Two-Way Between-Subjects Analysis of Variance117 Questions
Exam 18: Overview and Extension: Statistical Tests for More Complex Designs124 Questions
Select questions type
It is possible for two variables to be related to one another,but for no causal relationship to exist between them.
(True/False)
4.9/5  (37)
(37)
For a perfect negative linear relationship,the z scores for the Y and X variables will tend to have _____.
(Multiple Choice)
4.9/5 (28)
If the values of the variables X and Y are directly related,then as a score in X _____ the value of a score in Y _____.
(Multiple Choice)
4.7/5 (31)
Which of the following correlation scores represents the weakest relationship?
(Multiple Choice)
4.9/5 (36)
Outliers are most likely to raise interpretational complexities when sample sizes are small.
(True/False)
4.9/5 (31)
The Pearson correlation technique may be used to measure ______ relationships when both variables are ______ in nature.
(Multiple Choice)
5.0/5 (35)
Pearson correlation will detect linear and nonlinear relationships.
(True/False)
4.8/5 (31)
In the regression equation,  = 3)36 + 1.23X,which value is the y-intercept of the line?
(Multiple Choice)
4.9/5 (34)
Correlational analysis frequently demonstrates how one variable ______.
(Multiple Choice)
4.8/5 (27)
The technique which minimizes the squared vertical distances from the regression line to the data points is called the _____.
(Multiple Choice)
4.9/5 (35)
The _____ of a line indicates the number of units variable Y changes as variable X changes by 1 unit.
(Multiple Choice)
4.9/5 (35)
The number in a correlation matrix where a row intersects a column is
(Multiple Choice)
4.8/5 (40)
Which of the following linear relationships describes a situation in which the value of one variable increases as the value of the second variable decreases?
(Multiple Choice)
4.9/5 (36)
The correlation of any variable with itself is always ____________________.
(Short Answer)
4.9/5 (30)
Which correlation coefficient most closely represents the relationship depicted in the scatterplot below? 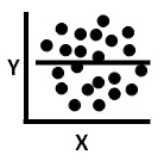
(Multiple Choice)
4.8/5 (26)
The _____ represents the average error across individuals in predicting scores on Y from the regression equation.
(Multiple Choice)
4.9/5 (42)
Which of the following correlation values represents the strongest relationship?
(Multiple Choice)
4.8/5 (35)
Filters
- Essay(0)
- Multiple Choice(0)
- Short Answer(0)
- True False(0)
- Matching(0)