Exam 5: Pearson Correlation and Regression: Descriptive Aspects
Exam 1: Introduction and Mathematical Preliminaries146 Questions
Exam 2: Frequency and Probability Distributions150 Questions
Exam 4: Percentiles percentile Ranks standard Scores and the Normal Distribution176 Questions
Exam 5: Pearson Correlation and Regression: Descriptive Aspects152 Questions
Exam 3: Measures of Central Tendency and Variability154 Questions
Exam 7: Estimation and Sampling Distributions151 Questions
Exam 8: Hypothesis Testing: Inferences About a Single Mean160 Questions
Exam 6: Probability149 Questions
Exam 9: Principles of Research Design and Statistical Preliminaries for Analyzing Bivariate Relationships150 Questions
Exam 10: Independent Groups T -Test149 Questions
Exam 11: Correlated Groups T-Test125 Questions
Exam 13: One-Way Repeated Measures Analysis of Variance140 Questions
Exam 14: Pearson Correlation and Regression: Inferential Aspects143 Questions
Exam 15: Chi-Square Test145 Questions
Exam 16: Nonparametric Statistics135 Questions
Exam 17: Two-Way Between-Subjects Analysis of Variance117 Questions
Exam 18: Overview and Extension: Statistical Tests for More Complex Designs124 Questions
Select questions type
Pearson correlation and regression can be used to determine the extent to which a data set approximates a ____________________ relationship.
(Short Answer)
4.8/5  (31)
(31)
The magnitude of the correlation coefficient is indexed by its:
(Multiple Choice)
4.8/5 (36)
A sum of squares indicates the extent to which two sets of scores vary from one another,or covary.
(True/False)
4.9/5 (37)
The regression equation for predicting X from Y is not the same as the regression equation for predicting Y from X.
(True/False)
4.7/5 (38)
The regression equation for predicting X from Y is the same as the regression equation for predicting Y from X.
(True/False)
4.7/5 (33)
The slope of a line indicates the number of units variable Y is predicted to change given a one unit change in X.
(True/False)
4.8/5 (27)
The extent of _____ between two variables is indexed by a statistic known as the Pearson correlation coefficient.
(Multiple Choice)
4.8/5 (30)
The Pearson correlation may be used to determine the _____.
(Multiple Choice)
4.9/5 (36)
Suppose you were interested in conducting a study examining how ratings of similarity between oneself and another person were related to how attracted one is to the other person.You conduct this study by giving participants a description of a person named "Sarah." Participants are asked to read the description and then rate on a scale from 1 to 10 how similar Sarah is to themselves.You also ask each participant to rate on a scale from 1 to 20 how likeable they think Sarah is.
X = rating of similarity of target to oneself
Y = rating of likability of the target ("Sarah")
62 people participate in your study,and you obtain the following data:  = 6.00 SCP = 66
  = 10.00 SSX = 40
SSY = 136
Calculate the Pearson correlation coefficient for the above data.
= 10.00 SSX = 40
SSY = 136
Calculate the Pearson correlation coefficient for the above data.
(Short Answer)
4.9/5 (39)
Which correlation coefficient most closely represents the relationship depicted in the scatterplot below? 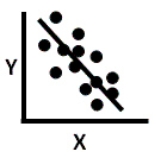
(Multiple Choice)
4.8/5 (39)
The point at which a line intersects the Y axis when X = 0 is called the _____.
(Multiple Choice)
4.9/5 (37)
Pearson correlation is an appropriate statistic for a nonlinear relationship.
(True/False)
4.8/5 (37)
Correlations for the types of variables typically studied by behavioral scientists will seldom exceed -.40 or +.40 and will often be considerably smaller.
(True/False)
4.8/5 (35)
Correlation and regression are appropriate for both linear and nonlinear relationships.
(True/False)
4.8/5 (39)
When two variables,X and Y,are correlated,it is possible that:
(Multiple Choice)
4.9/5 (32)
In the case of a _____ relationship,as scores on X increase,scores on Y also increase.
(Multiple Choice)
4.9/5 (29)
When there is no linear relationship,the z scores on X will ______.
(Multiple Choice)
4.9/5 (31)
Refer to the following data set.  What is the sum of cross-products?
(Multiple Choice)
4.9/5 (29)
When two variables,X and Y,are correlated,three possible reasons for their correlation are that (1)X might cause Y, (2)Y might cause X,or (3)some additional variable(s)might cause both X and Y.
(True/False)
4.7/5 (36)
Filters
- Essay(0)
- Multiple Choice(0)
- Short Answer(0)
- True False(0)
- Matching(0)