Exam 5: Pearson Correlation and Regression: Descriptive Aspects
Exam 1: Introduction and Mathematical Preliminaries146 Questions
Exam 2: Frequency and Probability Distributions150 Questions
Exam 4: Percentiles percentile Ranks standard Scores and the Normal Distribution176 Questions
Exam 5: Pearson Correlation and Regression: Descriptive Aspects152 Questions
Exam 3: Measures of Central Tendency and Variability154 Questions
Exam 7: Estimation and Sampling Distributions151 Questions
Exam 8: Hypothesis Testing: Inferences About a Single Mean160 Questions
Exam 6: Probability149 Questions
Exam 9: Principles of Research Design and Statistical Preliminaries for Analyzing Bivariate Relationships150 Questions
Exam 10: Independent Groups T -Test149 Questions
Exam 11: Correlated Groups T-Test125 Questions
Exam 13: One-Way Repeated Measures Analysis of Variance140 Questions
Exam 14: Pearson Correlation and Regression: Inferential Aspects143 Questions
Exam 15: Chi-Square Test145 Questions
Exam 16: Nonparametric Statistics135 Questions
Exam 17: Two-Way Between-Subjects Analysis of Variance117 Questions
Exam 18: Overview and Extension: Statistical Tests for More Complex Designs124 Questions
Select questions type
If two variables are related in a fashion that is nonlinear,Pearson correlation:
(Multiple Choice)
4.8/5  (32)
(32)
Which type of relationship is graphed in the following scatterplot? 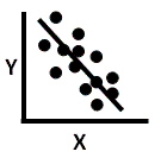
(Multiple Choice)
4.9/5 (30)
Regarding correlation and causation,if we observe a positive correlation between two variables,we cannot conclude that there is a ____________________ relationship between the two variables.
(Short Answer)
4.8/5 (39)
The range of the correlation coefficient is from -1.00 to ____________________.
(Short Answer)
4.7/5 (35)
Restricting the range of two variables will always lower the correlation between them.
(True/False)
4.8/5 (31)
The standard error of estimate represents an average error across individuals in predicting scores on Y from the regression equation.
(True/False)
4.8/5 (31)
A correlation coefficient of _____ means the two variables form a perfect linear relationship.
(Multiple Choice)
4.9/5 (39)
In the behavioral sciences where complex behaviors are studied,correlations in the .20 to .30 range (and the -.20 to -.30 range)are usually considered to be unimportant.
(True/False)
4.9/5 (37)
Suppose you were interested in conducting a study examining how ratings of similarity between oneself and another person were related to how attracted one is to the other person.You conduct this study by giving participants a description of a person named "Sarah." Participants are asked to read the description and then rate on a scale from 1 to 10 how similar Sarah is to themselves.You also ask each participant to rate on a scale from 1 to 20 how likeable they think Sarah is.
X = rating of similarity of target to oneself
Y = rating of likability of the target ("Sarah")
62 people participate in your study,and you obtain the following data:  = 6.00 SCP = 66
  = 10.00 SSX = 40
SSY = 136
Calculate the standard error of estimate for the above data.
= 10.00 SSX = 40
SSY = 136
Calculate the standard error of estimate for the above data.
(Short Answer)
4.8/5 (38)
Filters
- Essay(0)
- Multiple Choice(0)
- Short Answer(0)
- True False(0)
- Matching(0)