Exam 3: Demand and Supply
Exam 1: Nature and Scope of Managerial Economics25 Questions
Exam 2: Economic Optimization45 Questions
Exam 3: Demand and Supply50 Questions
Exam 4: Demand Analysis46 Questions
Exam 5: Demand Estimation49 Questions
Exam 6: Forecasting50 Questions
Exam 7: Production Analysis and Compensation Policy50 Questions
Exam 8: Cost Analysis and Estimation50 Questions
Exam 9: Linear Programming32 Questions
Exam 10: Competitive Markets50 Questions
Exam 11: Performance and Strategy in Competitive Markets50 Questions
Exam 12: Monopoly and Monopsony50 Questions
Exam 13: Monopolistic Competition and Oligopoly48 Questions
Exam 14: Game Theory and Competitive Strategy37 Questions
Exam 15: Pricing Practices47 Questions
Exam 16: Risk Analysis47 Questions
Exam 17: Capital Budgeting50 Questions
Exam 18: Organization Structure and Corporate Governance50 Questions
Exam 19: Government in the Market Economy50 Questions
Select questions type
If the market price is higher than the equilibrium price a:
(Multiple Choice)
4.8/5  (33)
(33)
Demand Curve Analysis. The Badger Bus Company is a regional bus line providing service between Milwaukee, Wisconsin and Chicago, Illinois. An analysis of the monthly demand for service has revealed the following demand relation:
 Where Q is quantity measured by the number of passengers per month, P is the price ($), PC is a price index for connecting bus routes (1992 = 100.), BAI is a business activity index (1992 = 100) and S, a binary or dummy variable, equals 1 in summer months, zero otherwise.
A. Determine the demand curve facing the bus service during the winter month of February if P = $40, PC = 120, BAI = 175, and S = 0.
B. Calculate the quantity demanded and total revenues during the summer month of August if all price-related variables are as specified above.
Where Q is quantity measured by the number of passengers per month, P is the price ($), PC is a price index for connecting bus routes (1992 = 100.), BAI is a business activity index (1992 = 100) and S, a binary or dummy variable, equals 1 in summer months, zero otherwise.
A. Determine the demand curve facing the bus service during the winter month of February if P = $40, PC = 120, BAI = 175, and S = 0.
B. Calculate the quantity demanded and total revenues during the summer month of August if all price-related variables are as specified above.
(Essay)
4.7/5 (42)
Holding all else equal, an increase in mandatory payments by employers for universal health care coverage for workers would lead to a decrease in the:
(Multiple Choice)
4.9/5 (43)
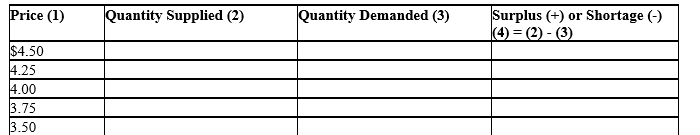
Demand and Supply Curves. The following relations describe demand and supply conditions in the milk industry:
 where Q is quantity measured in millions of gallons and P is price in dollars.

(Essay)
4.9/5 (39)
Demand Analysis. The demand for refrigerators is often described as cyclical, and very sensitive to refrigerator prices and interest rates. Given these characteristics, describe the effect of each of the following in terms of whether it would increase or decrease the quantity demanded or the demand for refrigerators. Moreover, when price is expressed as a function of quantity, indicate whether the effect of each of the following is an upward or downward movement along a given demand curve or instead involves an outward or inward shift in the relevant demand curve for refrigerators. Explain your answers.
A. An increase in refrigerator prices
B. A fall in interest rates
C. A rise in interest rates
D. A severe economic recession
E. A robust economic expansion
(Essay)
4.8/5 (35)
Comparative Statics. Coupon Promotions, Inc., is a coupon book publisher with markets in several southwestern states. CPI coupon books are sold directly to the public, sold through religious and other charitable organizations, or given away as promotional items. Operating experience during the past year suggests the following demand function for its coupon books:
 where Q is quantity, P is price ($), Pop is population, I is disposable income per capita ($), and A is advertising expenditures ($).
A. Determine the demand curve faced by CPI in a typical market where P = $5, Pop = 1,000,000 persons, I = $35,000 and A = $10,000. Show the demand curve with quantity expressed as a function of price, and price expressed as a function of quantity.
B. Calculate the quantity demanded at prices of $5, $2.50, and $0.
C. Calculate the prices necessary to sell 10,000, 25,000, and 50,000 units.
where Q is quantity, P is price ($), Pop is population, I is disposable income per capita ($), and A is advertising expenditures ($).
A. Determine the demand curve faced by CPI in a typical market where P = $5, Pop = 1,000,000 persons, I = $35,000 and A = $10,000. Show the demand curve with quantity expressed as a function of price, and price expressed as a function of quantity.
B. Calculate the quantity demanded at prices of $5, $2.50, and $0.
C. Calculate the prices necessary to sell 10,000, 25,000, and 50,000 units.
(Essay)
4.8/5 (40)
Demand is the total quantity of goods or services that customers:
(Multiple Choice)
4.9/5 (40)
Quantity Demanded. The Sharper Edge, Inc. is a leading retailer of Yingsu Knives, a set of kitchen cutlery, which it markets on a nationwide basis. SEI knife sets are either sold directly to the public through national television marketing programs, or given away as promotional items. Operating experience during the past year suggests the following demand function for its knife sets:
 Where Q is quantity, P is the price ($), N is the average Nielson rating of television programs during which SEI advertises Yingsu Knives, I is average disposable income per household ($), and A is advertising expenditures ($).
A. Determine the demand curve faced by SEI in a typical market where P = $35, N = 18.5, I = $44,000, and A = $500,000. Show the demand curve with quantity expressed as a function of price, and price expressed as a function of quantity.
B. Calculate the quantity demanded at prices of $40, $35, and $30.
C. Calculate the prices necessary to sell 264,000, 292,000, and 320,000 sets of knives.
Where Q is quantity, P is the price ($), N is the average Nielson rating of television programs during which SEI advertises Yingsu Knives, I is average disposable income per household ($), and A is advertising expenditures ($).
A. Determine the demand curve faced by SEI in a typical market where P = $35, N = 18.5, I = $44,000, and A = $500,000. Show the demand curve with quantity expressed as a function of price, and price expressed as a function of quantity.
B. Calculate the quantity demanded at prices of $40, $35, and $30.
C. Calculate the prices necessary to sell 264,000, 292,000, and 320,000 sets of knives.
(Essay)
4.8/5 (33)
Comparative Statics. Demand and supply conditions in the market for utility-generated electric power are important concerns to business and government decision makers. Some of the following factors have the potential to influence the demand or quantity demanded of electric power. Influences on the supply or quantity supplied may also result. Holding all else equal, describe these influences as increasing or decreasing, and indicate the direction of the resulting movement along or shift in the relevant curve(s).
A. An increase in the strategic desirability for large manufacturers to co-generate (or self-generate) power.
B. Congress mandates reduced emissions from coal combustion.
C. Environmentalist groups spark a conservation effort nationwide.
D. A health study finds a positive correlation between number of hours under a heat lamp and reduced risk of cancer.
E. An advance in solar technology creates very efficient collection devices, allowing for cheap and efficient roof-top solar energy.
(Essay)
5.0/5 (32)
Quantity Demanded. Gurgling Springs, Inc. is a bottler of natural spring water distributed throughout the New England states. Five-gallon containers of GSI spring water are regionally promoted and distributed through grocery chains. Operating experience during the past year suggests the following demand function for its spring water:
 where Q is quantity in thousands of five-gallon containers, P is price ($), Pop is population, I is disposable income per capita ($), and A is advertising expenditures ($).
A. Determine the demand curve faced by CPI in a typical market where P = $4, Pop = 4,000,000 persons, I = $50,000 and A = $400,000. Show the demand curve with quantity expressed as a function of price, and price expressed as a function of quantity.
B. Calculate the quantity demanded at prices of $5, $4, and $3.
C. Calculate the prices necessary to sell 1,250, 1,500, and 1,750 thousands of five-gallon containers.
where Q is quantity in thousands of five-gallon containers, P is price ($), Pop is population, I is disposable income per capita ($), and A is advertising expenditures ($).
A. Determine the demand curve faced by CPI in a typical market where P = $4, Pop = 4,000,000 persons, I = $50,000 and A = $400,000. Show the demand curve with quantity expressed as a function of price, and price expressed as a function of quantity.
B. Calculate the quantity demanded at prices of $5, $4, and $3.
C. Calculate the prices necessary to sell 1,250, 1,500, and 1,750 thousands of five-gallon containers.
(Essay)
4.8/5 (39)
Market Equilibrium. Various beverages are sold by roving vendors at Busch Stadium, home of the St. Louis Cardinals. Demand and supply of the product are both highly sensitive to changes in the weather. During hot summer months, demand for ice-cold beverages grows rapidly. On the other hand, hot dry weather has an adverse effect on supply in that it taxes the stamina of the vendor carrying his or her goods up and down many flights of stairs. The only competition for this service is provided by the beverages that can be purchased at kiosks located throughout the stadium.
Demand and supply functions for ice-cold beverages per game are as follows:
 where P is the average price of ice-cold beverage ($ per beverage), PK is the average price of beverages sold at the kiosks ($ per beverage), Y is disposable income per household for baseball fans, T is the average daily high temperature (degrees), PL is the average price of unskilled labor ($ per hour), and PC is the average cost of capital (in percent).
A. When quantity is expressed as a function of price, what are the ice-cold beverage demand and supply curves if P = $5, PK = $4, Y = $62,500, T = 80 degrees, PL = $10, and PC = 12%.
B. Calculate the surplus or shortage of ice-cold beverage when P = $4, $5, and $6.
C. Calculate the market equilibrium price-output combination.
where P is the average price of ice-cold beverage ($ per beverage), PK is the average price of beverages sold at the kiosks ($ per beverage), Y is disposable income per household for baseball fans, T is the average daily high temperature (degrees), PL is the average price of unskilled labor ($ per hour), and PC is the average cost of capital (in percent).
A. When quantity is expressed as a function of price, what are the ice-cold beverage demand and supply curves if P = $5, PK = $4, Y = $62,500, T = 80 degrees, PL = $10, and PC = 12%.
B. Calculate the surplus or shortage of ice-cold beverage when P = $4, $5, and $6.
C. Calculate the market equilibrium price-output combination.
(Essay)
4.8/5 (32)
If the production of two goods is complementary a decrease in the price of one will:
(Multiple Choice)
4.9/5 (35)
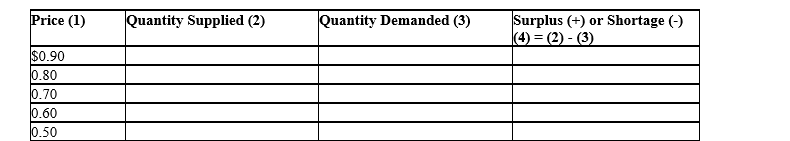
Demand and Supply Curves. The following relations describe demand and supply conditions in the wheat industry:
 where Q is quantity measured in millions of bushels and P is price in dollars.

(Essay)
4.7/5 (33)
The effect on sales of an increase in price is a decrease in:
(Multiple Choice)
4.9/5 (34)
A demand curve expresses the relation between the quantity demanded and:
(Multiple Choice)
4.9/5 (37)
Filters
- Essay(0)
- Multiple Choice(0)
- Short Answer(0)
- True False(0)
- Matching(0)