Exam 3: Demand and Supply
Exam 1: Nature and Scope of Managerial Economics25 Questions
Exam 2: Economic Optimization45 Questions
Exam 3: Demand and Supply50 Questions
Exam 4: Demand Analysis46 Questions
Exam 5: Demand Estimation49 Questions
Exam 6: Forecasting50 Questions
Exam 7: Production Analysis and Compensation Policy50 Questions
Exam 8: Cost Analysis and Estimation50 Questions
Exam 9: Linear Programming32 Questions
Exam 10: Competitive Markets50 Questions
Exam 11: Performance and Strategy in Competitive Markets50 Questions
Exam 12: Monopoly and Monopsony50 Questions
Exam 13: Monopolistic Competition and Oligopoly48 Questions
Exam 14: Game Theory and Competitive Strategy37 Questions
Exam 15: Pricing Practices47 Questions
Exam 16: Risk Analysis47 Questions
Exam 17: Capital Budgeting50 Questions
Exam 18: Organization Structure and Corporate Governance50 Questions
Exam 19: Government in the Market Economy50 Questions
Select questions type
Demand Analysis. The demand for high-definition television sets (HDTV) is often described as highly cyclical, and very sensitive to HDTV prices and interest rates. Given these characteristics, describe the effect of each of the following in terms of whether it would increase or decrease the quantity demanded or the demand of HDTVs. Moreover, when price is expressed as a function of quantity, indicate whether the effect of each of the following is an upward or downward movement along a given demand curve or instead involves an outward or inward shift in the relevant demand curve for HDTVs. Explain your answers.
A. A decrease in HDTV prices
B. A fall in interest rates
C. A rise in interest rates
D. A severe economic recession
E. A robust economic expansion
Free
(Essay)
4.8/5  (31)
(31)
Correct Answer: Verified

Change in the quantity supplied reflects a:
Free
(Multiple Choice)
4.7/5 (41)
Correct Answer:Verified
A
Demand Curve Analysis. Air California, Inc. is a regional airline providing service between Los Angeles, California and Las Vegas, Nevada. An analysis of the monthly demand for service has revealed the following demand relation:
 Where Q is quantity measured by the number of passengers per month, P is the price ($), PC is a price index for connecting flights (1982 = 100.), BAI is a business activity index (1982 = 100) and S, a binary or dummy variable, equals 1 in summer months, zero otherwise.
A. Determine the demand curve facing the airline during the winter month of January if P = $100, PC = 150, BAI = 200, and S = 0.
B. Calculate the quantity demanded and total revenues during the summer month of July if all price-related variables are as specified above.
Where Q is quantity measured by the number of passengers per month, P is the price ($), PC is a price index for connecting flights (1982 = 100.), BAI is a business activity index (1982 = 100) and S, a binary or dummy variable, equals 1 in summer months, zero otherwise.
A. Determine the demand curve facing the airline during the winter month of January if P = $100, PC = 150, BAI = 200, and S = 0.
B. Calculate the quantity demanded and total revenues during the summer month of July if all price-related variables are as specified above.
Free
(Essay)
4.8/5 (41)
Correct Answer:Verified


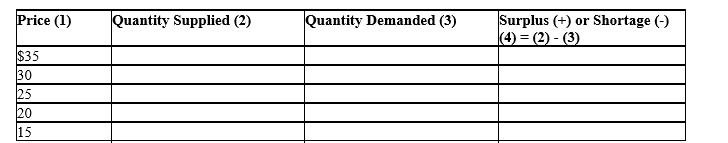
Demand and Supply Curves. The following relations describe demand and supply conditions in the oil industry:
 where Q is quantity measured in millions of barrels and P is price in dollars.

(Essay)
4.8/5 (39)
The equilibrium market price of lead pencils would decrease and the quantity of pencils produced and sold would increase if:
(Multiple Choice)
4.8/5 (38)
Comparative Statics. Demand and supply conditions in the steel market are important concerns to business and government decision makers. Some of the following factors have the potential to influence the demand or quantity demanded of raw steel. Influences on the supply or quantity supplied may also result. Holding all else equal, describe these influences as increasing or decreasing, and indicate the direction of the resulting movement along or shift in the relevant curve(s).
A. Increases in the U. S. Department of Transportation's mileage requirements for car fleets.
B. Public outcry at the poor condition of the nation's interstate freeway system.
C. New alloys that increase steel's tensile strength are created.
D. A severe recession.
E. A new technology reduces the production cost of raw steel by one-third.
(Essay)
4.9/5 (37)
Demand Analysis. The demand for automobiles is often described as highly cyclical, and very sensitive to automobile prices and interest rates. Given these characteristics, describe the effect of each of the following in terms of whether it would increase or decrease the quantity demanded or the demand for automobiles. Moreover, when price is expressed as a function of quantity, indicate whether the effect of each of the following is an upward or downward movement along a given demand curve or instead involves an outward or inward shift in the relevant demand curve for autos. Explain your answers.
A. A decrease in auto prices
B. A fall in interest rates
C. A rise in interest rates
D. A severe economic recession
E. A robust economic expansion
(Essay)
4.8/5 (36)
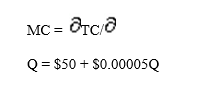
Supply Curve Analysis. Computers.com is a leading Internet retailer of high-performance desktop computers. Based on an analysis of monthly cost and output data, the company has estimated the following relation between its marginal cost of production and monthly output:
 A. Calculate the marginal cost of production at 100,000, 200,000, and 300,000 units of output.
B. Express output as a function of marginal cost. Calculate the level of output at which MC = $1,000, $1,500 and $2,000.
C. Calculate the profit-maximizing level of output if prices are stable in the industry at $1,500 per unit and, therefore, P = MR = $1,500.
D. Again assuming prices are stable in the industry, derive the firm's supply curve. Express price as a function of quantity and quantity as a function of price.
A. Calculate the marginal cost of production at 100,000, 200,000, and 300,000 units of output.
B. Express output as a function of marginal cost. Calculate the level of output at which MC = $1,000, $1,500 and $2,000.
C. Calculate the profit-maximizing level of output if prices are stable in the industry at $1,500 per unit and, therefore, P = MR = $1,500.
D. Again assuming prices are stable in the industry, derive the firm's supply curve. Express price as a function of quantity and quantity as a function of price.
(Essay)
4.8/5 (31)
Industry Supply. Stanford Plastics, Inc. and Cal-Tech Associates, Inc. supply a generic phone jack that connects telephone cords to phone outlets. Proprietary cost and output information for each company reveal the following relations between marginal cost and output:
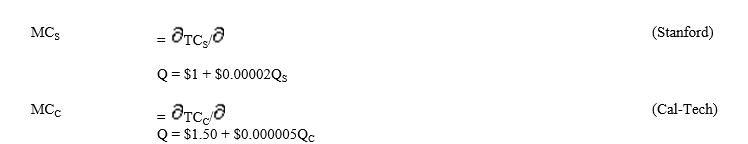 The wholesale market for modular phone jacks is vigorously price-competitive, and neither firm is able to charge a premium for its products. Thus, P = MR in this market.
A. Determine the supply curve for each firm. Express price as a function of quantity and quantity as a function of price. (Hint: Set P = MR = MC to find each firm's supply curve.)
B. Calculate the quantity supplied by each firm at prices of $1, $1.50, and $2. What is the minimum price necessary for each individual firm to supply output?
C. Determine the industry supply curve when P < $1.50.
D. Determine the industry supply curve when P > $1.50. To check your answer, calculate quantity at an industry price of $2 and compare your answer with part B.
The wholesale market for modular phone jacks is vigorously price-competitive, and neither firm is able to charge a premium for its products. Thus, P = MR in this market.
A. Determine the supply curve for each firm. Express price as a function of quantity and quantity as a function of price. (Hint: Set P = MR = MC to find each firm's supply curve.)
B. Calculate the quantity supplied by each firm at prices of $1, $1.50, and $2. What is the minimum price necessary for each individual firm to supply output?
C. Determine the industry supply curve when P < $1.50.
D. Determine the industry supply curve when P > $1.50. To check your answer, calculate quantity at an industry price of $2 and compare your answer with part B.
(Essay)
4.9/5 (38)
Optimal Supply. Shake-n-Shing, Inc., is a supplier of wood shakes and shingles used in home construction. Shakes and shingles are sold by the bundle. Based on an analysis of monthly cost and output data, the company has estimated the following relation between its marginal costs and monthly output:
 A. Calculate marginal cost at 500,000, 700,000, and 900,000 bundles of output.
B. Express output as a function of marginal cost. Calculate the level of output at which MC = $75, $100 and $125.
C. Calculate the profit-maximizing level of output if prices are stable in the industry at $100 per bundle, and, therefore, P = MR = $100.
D. Again assuming prices are stable in the industry, derive Shake-n-Shing's supply curve for bundles of shakes and shingles. Express price as a function of quantity and quantity as a function of price.
A. Calculate marginal cost at 500,000, 700,000, and 900,000 bundles of output.
B. Express output as a function of marginal cost. Calculate the level of output at which MC = $75, $100 and $125.
C. Calculate the profit-maximizing level of output if prices are stable in the industry at $100 per bundle, and, therefore, P = MR = $100.
D. Again assuming prices are stable in the industry, derive Shake-n-Shing's supply curve for bundles of shakes and shingles. Express price as a function of quantity and quantity as a function of price.
(Essay)
4.8/5 (46)
Demand and Supply Curves. The following relations describe demand and supply conditions in the lumber/forest products industry:
 where Q is quantity measured in thousands of board feet (one square foot of lumber, one inch thick) and P is price in dollars.

(Essay)
4.7/5 (40)
Comparative Statics. Demand and supply conditions in the market for unskilled labor are important concerns to business and government decision makers. Consider the case of a federally mandated minimum wage set above the equilibrium or market clearing wage level. Some of the following factors have the potential to influence the demand or quantity demanded of unskilled labor. Influences on the supply or quantity supplied may also result. Holding all else equal, describe these influences as increasing or decreasing, and indicate the direction of the resulting movement along or shift in the relevant curve(s).
A. An increase in the popularity of self-service gas stations, car washes, and so on.
B. A fall in welfare benefits
C. An increase in the minimum wage
D. A rise in interest rates
E. A decrease in the quality of secondary education
(Essay)
4.9/5 (38)
Supply Curve Analysis. A review of industry-wide data for the frozen grape juice manufacturing industry suggests the following industry supply function:
 where Q is cases supplied per year, P is the wholesale price per case ($), PL is the average price paid for unskilled labor ($), PK is the average price of capital (in percent), and W is weather measured by the average seasonal temperature in growing areas (in Fahrenheit).
A. Determine the industry supply curve for a recent year when P = $40, PL = $10, PK = 15%, and W = 70 degrees Fahrenheit. Show the industry supply curve with quantity expressed as a function of price and price expressed as a function of quantity.
B. Calculate the quantity supplied by the industry at prices of $30, $40 and $50 per case.
C. Calculate the prices necessary to generate a supply of 10 million, 25 million, and 40 million cases.
where Q is cases supplied per year, P is the wholesale price per case ($), PL is the average price paid for unskilled labor ($), PK is the average price of capital (in percent), and W is weather measured by the average seasonal temperature in growing areas (in Fahrenheit).
A. Determine the industry supply curve for a recent year when P = $40, PL = $10, PK = 15%, and W = 70 degrees Fahrenheit. Show the industry supply curve with quantity expressed as a function of price and price expressed as a function of quantity.
B. Calculate the quantity supplied by the industry at prices of $30, $40 and $50 per case.
C. Calculate the prices necessary to generate a supply of 10 million, 25 million, and 40 million cases.
(Essay)
4.8/5 (35)
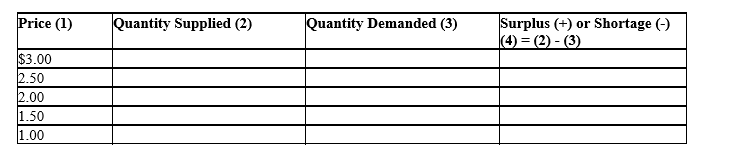
Market Equilibrium. Florida Orange Juice is a product of Florida's Orange Growers' Association. Demand and supply of the product are both highly sensitive to changes in the weather. During hot summer months, demand for orange juice and other beverages grows rapidly. On the other hand, hot dry weather has an adverse effect on supply by reducing the size of the orange crop.
Demand and supply functions for Florida orange juice are as follows:
 where P is the average price of Florida ($ per case), PS is the average retail price of canned soda ($ per case), Y is income (GNP in $billions), T is the average daily high temperature (degrees), PL is the average price of unskilled labor ($ per hour), and PK is the average cost of capital (in percent).
A. When quantity is expressed as a function of price, what are the Florida demand and supply curves if P = $11, PS = $5, Y = $12,000 billion, T = 75 degrees, PL = $6, and PK = 12.5%.
B. Calculate the surplus or shortage of Florida orange juice when P = $5, $10, and $15.
C. Calculate the market equilibrium price-output combination.
where P is the average price of Florida ($ per case), PS is the average retail price of canned soda ($ per case), Y is income (GNP in $billions), T is the average daily high temperature (degrees), PL is the average price of unskilled labor ($ per hour), and PK is the average cost of capital (in percent).
A. When quantity is expressed as a function of price, what are the Florida demand and supply curves if P = $11, PS = $5, Y = $12,000 billion, T = 75 degrees, PL = $6, and PK = 12.5%.
B. Calculate the surplus or shortage of Florida orange juice when P = $5, $10, and $15.
C. Calculate the market equilibrium price-output combination.
(Essay)
4.9/5 (47)
The supply curve expresses the relation between the aggregate quantity supplied and:
(Multiple Choice)
4.8/5 (40)
Supply Curve Analysis. A review of industry-wide data for the domestic wine manufacturing industry suggests the following industry supply function:
 where Q is cases supplied per year, P is the wholesale price per case ($), PL is the average price paid for unskilled labor ($), PK is the average price of capital (in percent), and W is weather measured by the average seasonal rainfall in growing areas (in inches).
A. Determine the industry supply curve for a recent year when P = $80, PL = $10, PK = 12%, and W = 25 inches of rainfall. Show the industry supply curve with quantity expressed as a function of price and price expressed as a function of quantity.
B. Calculate the quantity supplied by the industry at prices of $50, $75 and $100 per case.
C. Calculate the prices necessary to generate a supply of 10 million, 25 million, and 50 million cases.
where Q is cases supplied per year, P is the wholesale price per case ($), PL is the average price paid for unskilled labor ($), PK is the average price of capital (in percent), and W is weather measured by the average seasonal rainfall in growing areas (in inches).
A. Determine the industry supply curve for a recent year when P = $80, PL = $10, PK = 12%, and W = 25 inches of rainfall. Show the industry supply curve with quantity expressed as a function of price and price expressed as a function of quantity.
B. Calculate the quantity supplied by the industry at prices of $50, $75 and $100 per case.
C. Calculate the prices necessary to generate a supply of 10 million, 25 million, and 50 million cases.
(Essay)
4.8/5 (39)
If demand increases while supply decreases for a particular good, the:
(Multiple Choice)
4.8/5 (40)
Industry Supply. Columbia Pharmaceuticals, Inc., and Princeton Medical, Ltd., supply a generic drug equivalent of an antibiotic used to treat postoperative infections. Proprietary cost and output information for each company reveal the following relations between marginal cost and output:
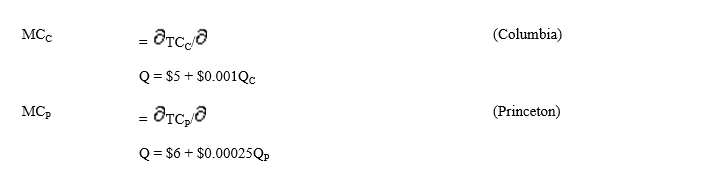 The wholesale market for generic drugs is vigorously price-competitive, and neither firm is able to charge a premium for its products. Thus, P = MR in this market.
A. Determine the supply curve for each firm. Express price as a function of quantity and quantity as a function of price. (Hint: Set P = MR = MC to find each firm's supply curve.)
B. Calculate the quantity supplied by each firm at prices of $5, $7.50, and $10. What is the minimum price necessary for each individual firm to supply output?
C. Determine the industry supply curve when P < $6.
D. Determine the industry supply curve when P > $6. To check your answer, calculate quantity at an industry price of $10 and compare your answer with part B.
The wholesale market for generic drugs is vigorously price-competitive, and neither firm is able to charge a premium for its products. Thus, P = MR in this market.
A. Determine the supply curve for each firm. Express price as a function of quantity and quantity as a function of price. (Hint: Set P = MR = MC to find each firm's supply curve.)
B. Calculate the quantity supplied by each firm at prices of $5, $7.50, and $10. What is the minimum price necessary for each individual firm to supply output?
C. Determine the industry supply curve when P < $6.
D. Determine the industry supply curve when P > $6. To check your answer, calculate quantity at an industry price of $10 and compare your answer with part B.
(Essay)
4.9/5 (44)
Filters
- Essay(0)
- Multiple Choice(0)
- Short Answer(0)
- True False(0)
- Matching(0)