Exam 3: Demand and Supply
Exam 1: Nature and Scope of Managerial Economics25 Questions
Exam 2: Economic Optimization45 Questions
Exam 3: Demand and Supply50 Questions
Exam 4: Demand Analysis46 Questions
Exam 5: Demand Estimation49 Questions
Exam 6: Forecasting50 Questions
Exam 7: Production Analysis and Compensation Policy50 Questions
Exam 8: Cost Analysis and Estimation50 Questions
Exam 9: Linear Programming32 Questions
Exam 10: Competitive Markets50 Questions
Exam 11: Performance and Strategy in Competitive Markets50 Questions
Exam 12: Monopoly and Monopsony50 Questions
Exam 13: Monopolistic Competition and Oligopoly48 Questions
Exam 14: Game Theory and Competitive Strategy37 Questions
Exam 15: Pricing Practices47 Questions
Exam 16: Risk Analysis47 Questions
Exam 17: Capital Budgeting50 Questions
Exam 18: Organization Structure and Corporate Governance50 Questions
Exam 19: Government in the Market Economy50 Questions
Select questions type
The quantity of product X supplied can be expected to rise with a fall in:
(Multiple Choice)
4.9/5  (34)
(34)
Oil refiners can vary the mix of gasoline versus diesel fuel derived from a barrel of oil. If the price of diesel fuel increases relative to the price of gasoline:
(Multiple Choice)
4.8/5 (36)
Holding all else equal, an unnecessary increase in federally-mandated auto safety requirements leads to a decrease in:
(Multiple Choice)
4.7/5 (39)
The equilibrium market price and quantity of beef would increase if:
(Multiple Choice)
4.9/5 (38)
Supply Curve Analysis. Credible Switches, Inc., is a distributor of generic safety switches used in the washing machines and dryers. Based on an analysis of monthly cost and output data, the company has estimated the following relation between the marginal cost (wholesale cost plus distribution cost per unit) and monthly output:
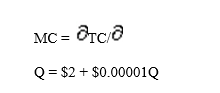
 A. Calculate marginal cost at 400,000, 500,000, and 600,000 units of output.
B. Express output as a function of marginal cost. Calculate the level of output at which MC = $5, $8, and $10.
C. Calculate the profit-maximizing level of output if prices are stable in the industry at $8 per switch and, therefore, P = MR = $8.
D. Again assuming prices are stable in the industry, derive CSI's supply curve for switches. Express price as a function of quantity and quantity as a function of price.
A. Calculate marginal cost at 400,000, 500,000, and 600,000 units of output.
B. Express output as a function of marginal cost. Calculate the level of output at which MC = $5, $8, and $10.
C. Calculate the profit-maximizing level of output if prices are stable in the industry at $8 per switch and, therefore, P = MR = $8.
D. Again assuming prices are stable in the industry, derive CSI's supply curve for switches. Express price as a function of quantity and quantity as a function of price.
(Essay)
5.0/5 (33)
The demand function for a product states the relation between the aggregate quantity demanded and:
(Multiple Choice)
4.8/5 (32)
Demand Curve Analysis. Papa's Pizza, Ltd., provides delivery and carryout service to the city of South Bend, Indiana. An analysis of the daily demand for pizzas has revealed the following demand relation:
 where Q is the quantity measured by the number of pizzas per day, P is the price ($), PS is a price index for soda pop (1992 = 100), CSP is the college student population and S, a binary or dummy variable, equals 1 on Friday, Saturday and Sunday, zero otherwise.
A. Determine the demand curve facing Papa's Pizza on Tuesdays if P = $10, PS = 125, and CSP = 35,000, and S = 0.
B. Calculate the quantity demanded and total revenues on Fridays if all price-related variables are as specified above.
where Q is the quantity measured by the number of pizzas per day, P is the price ($), PS is a price index for soda pop (1992 = 100), CSP is the college student population and S, a binary or dummy variable, equals 1 on Friday, Saturday and Sunday, zero otherwise.
A. Determine the demand curve facing Papa's Pizza on Tuesdays if P = $10, PS = 125, and CSP = 35,000, and S = 0.
B. Calculate the quantity demanded and total revenues on Fridays if all price-related variables are as specified above.
(Essay)
5.0/5 (29)
Filters
- Essay(0)
- Multiple Choice(0)
- Short Answer(0)
- True False(0)
- Matching(0)