Exam 2: Visual Description of Data
Exam 1: A Preview of Business Statistics55 Questions
Exam 2: Visual Description of Data67 Questions
Exam 3: Statistical Description of Data146 Questions
Exam 4: Data Collection and Sampling Methods104 Questions
Exam 5: Probability: Review of Basic Concepts188 Questions
Exam 6: Discrete Probability Distributions140 Questions
Exam 7: Continuous Probability Distributions160 Questions
Exam 8: Sampling Distributions108 Questions
Exam 9: Estimation From Sample Data150 Questions
Exam 10: Hypothesis Tests Involving a Sample Mean or Proportion170 Questions
Exam 11: Hypothesis Tests Involving Two Sample Means149 Questions
Exam 12: Analysis of Variance Tests173 Questions
Exam 13: Chi-Square Applications134 Questions
Exam 14: Nonparametric Methods139 Questions
Exam 15: Simple Linear Regression and Correlation145 Questions
Exam 16: Multiple Regression and Correlation98 Questions
Exam 17: Model Building83 Questions
Exam 18: Models for Time Series and Forecasting127 Questions
Exam 19: Decision Theory82 Questions
Exam 20: Total Quality Management132 Questions
Select questions type
The following stem-and-leaf output has been generated by Minitab. Stem-and-leaf of C2
Leaf Unit
2 -153 4 -097 (2) -065 4 03 3 06 2 13 1 18 Which of the following statements are correct?
Free
(Multiple Choice)
4.8/5  (30)
(30)
Correct Answer: Verified
E
Compared to the frequency distribution,the stem-and-leaf display provides more detail since it can describe the individual data values as well as show how many are in each group,or stem.
Free
(True/False)
4.7/5 (36)
Correct Answer:Verified
True
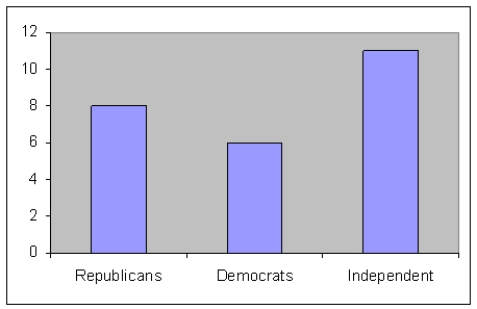
Voters participating in a recent election exit poll in Michigan were asked to state their political party affiliation.Coding the data 1 for Republican,2 for Democrat and 3 for Independent,the data collected were as follows: 3,2,3,2,1,1,3,2,1,3,1,2,3,1,3,3,3,3,2,1,1,3,2,3,1
Construct a frequency bar chart.
Free
(Essay)
4.8/5 (30)
Correct Answer:Verified
What is a scatter diagram,and for what kind of data is it a useful descriptive device?
(Essay)
4.9/5 (31)
Raw data are converted to frequency distributions and visual displays that provide us with a "big picture" of the information collected.
(True/False)
4.8/5 (38)
When some of the variables represent categories,we can apply a useful summarization method called tabulation,where we simply count how many people or items are in each category or combination of categories.
(True/False)
4.9/5 (33)
A friend has constructed the following frequency distribution of test scores in his business statistics class:
Score Number af Students 40 and below 2 40-50 6 50-60 8 60-70 13 70-80 11 80-90 5 90 and above 4 He asks for your feedback.What advice would you give him?
(Essay)
4.9/5 (34)
The following table represents exam grades from 36 students in a statistics class.Construct a pie chart using classes with grades 51-60,61-70,71-80,81-90,and 91-100.
60 79 75 84 85 74 95 58 66 98 99 99 62 86 85 99 79 82 98 72 72 72 75 88 86 81 96 86 78 91 83 85 92 68
(Essay)
4.7/5 (32)
What is the difference between a histogram and a bar chart? For what type of data would each be appropriate?
(Essay)
4.8/5 (32)
The grades on a chemistry exam for a sample of 40 students are as follows: 47 82 83 54 79 62 68 58 41 48 84 68 71 91 71 86 69 75 94 55 62 64 67 76 79 61 81 77 59 38 57 74 42 56 51 54 36 65 68 63 Estimate the percentage of grades that are between 80 and 90.
(Short Answer)
4.9/5 (33)
The midway point between the upper and lower class limits for a frequency distribution is known as the:
(Multiple Choice)
4.9/5 (35)
The ____________________ a variant of the frequency distribution,uses a subset of the original digits in the raw data as class descriptors and class members.
(Short Answer)
4.8/5 (33)
A stem-and-leaf display describes two-digit integers between 20 and 80.For one of the classes displayed,the row appears as 5|246.What numerical values are being described?
(Multiple Choice)
4.8/5 (44)
The ____________________ is a diagram in which each point represents a pair of known or observed values of two variables.
(Short Answer)
4.8/5 (38)
A recent Wall Street Journal survey found that 523 Democrats and 765 Republicans and believe legal immigration has a positive effect on the Untied States.Display this data in a bar chart.
(Essay)
5.0/5 (35)
When variables are used as the basis for a cross-tabulation,what scale of measurement must they represent?
(Essay)
4.7/5 (31)
In a __________,we can generate a display that describes how a selected qualitative variable tends to differ from one category to another.
(Multiple Choice)
4.8/5 (27)
Filters
- Essay(0)
- Multiple Choice(0)
- Short Answer(0)
- True False(0)
- Matching(0)