Exam 2: Visual Description of Data
Exam 1: A Preview of Business Statistics55 Questions
Exam 2: Visual Description of Data67 Questions
Exam 3: Statistical Description of Data146 Questions
Exam 4: Data Collection and Sampling Methods104 Questions
Exam 5: Probability: Review of Basic Concepts188 Questions
Exam 6: Discrete Probability Distributions140 Questions
Exam 7: Continuous Probability Distributions160 Questions
Exam 8: Sampling Distributions108 Questions
Exam 9: Estimation From Sample Data150 Questions
Exam 10: Hypothesis Tests Involving a Sample Mean or Proportion170 Questions
Exam 11: Hypothesis Tests Involving Two Sample Means149 Questions
Exam 12: Analysis of Variance Tests173 Questions
Exam 13: Chi-Square Applications134 Questions
Exam 14: Nonparametric Methods139 Questions
Exam 15: Simple Linear Regression and Correlation145 Questions
Exam 16: Multiple Regression and Correlation98 Questions
Exam 17: Model Building83 Questions
Exam 18: Models for Time Series and Forecasting127 Questions
Exam 19: Decision Theory82 Questions
Exam 20: Total Quality Management132 Questions
Select questions type
The general manager of a chain of furniture stores believes that experience is the most important factor in determining the level of success of a salesperson.To examine this belief she records last month's sales (in $1,000s)and the years of experience of 10 randomly selected salespeople.These data are listed below. Salesperson Years of Experience Sales 1 0 7 2 2 9 3 10 20 4 3 15 5 8 18 6 5 14 7 12 20 8 7 17 9 20 30 10 15 25 Interpret the value of the slope of the regression line.
(Essay)
4.8/5  (35)
(35)
Discuss the guidelines that are recommended for constructing a frequency distribution.
(Essay)
4.8/5 (34)
A recent Wall Street Journal poll asked a sample of professional,white collar,and blue-collar workers whether they felt legal immigration had a positive effect on the United States.The responses were graphed as follows: 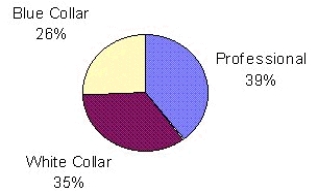 Identify the type of chart shown,and describe the information it gives.
(Essay)
4.8/5 (35)
Consider the following cumulative frequency distribution.
Clas5 Linnits Cumulative Freqquency ] - under 5 10 5 - under 10 15 10 - under 15 21 15 - under 20 29 20 - under 25 36 Find the frequencies for each of the following classes:
a.0 - under 5
b.5 - under 10
c.10 - under 15
d.15 - under 20
e.20 - under 25
(Short Answer)
4.7/5 (34)
The following stem-and-leaf output has been generated by Minitab. Stem-and-leaf of C2
Leaf Unit
2 -1 31 4 -0 86 (2) -0 41 4 0 1 3 0 8 2 1 1 1 1 8 How many values are positive?
(Short Answer)
4.9/5 (38)
A frequency distribution may be converted to show either relative or cumulative frequencies for the data.
(True/False)
4.8/5 (31)
A professor of economics wants to study the relationship between income and education.A sample of 10 individuals is selected at random,and their income (in thousand of dollars)and education (in years)are shown below: Education 12 14 10 11 13 8 10 15 13 12 Income 25 31 20 24 28 15 21 35 29 27 Draw a scatter diagram for these data with the income on the vertical axis.Describe the relationship between income and education.
(Essay)
5.0/5 (47)
In a raw data listing,data are listed in increasing or decreasing numerical order.
(True/False)
4.8/5 (43)
A cumulative frequency distribution lists the number of observations that are within or ____________________ each of the classes.
(Short Answer)
4.9/5 (42)
The width (class interval)of a frequency distribution class is the difference between the smallest and largest values in a data set.
(True/False)
4.9/5 (36)
The following table represents exam grades from 36 students in a statistics class.Construct a stem-and-leaf display.
60 79 75 84 85 74 95 58 66 98 99 99 62 86 85 99 79 82 98 72 72 72 75 88 86 81 96 86 78 91 83 85 92 68
(Essay)
5.0/5 (35)
Contingency tables are used primarily for counts involving qualitative data.
(True/False)
4.9/5 (41)
A physician takes the following sample of blood cholesterol levels form a group of volunteers (one reading per volunteer): 221, 202, 216, 227, 232, 218, 225, 234, 203, 247.
a. In what form, if any are these data organized?
b. Construct a frequency distribution, with class intervals of 10 points for these results.
(Essay)
4.9/5 (32)
The set of classes in the frequency distribution should be selected so that any given value falls into at least one category.
(True/False)
4.7/5 (35)
The ages of a sample of 25 salespersons are as follows:
47 21 37 53 28 40 30 32 34 34 24 24 35 45 38 35 28 43 30 45 31 41 54 26 45 Use Excel or Minitab to draw a histogram with five classes.
(Essay)
4.8/5 (38)
The largest value in a set of data is 160,and the smallest value is 70.If the resulting frequency distribution is to have six classes of equal width,what will be the class interval?
(Multiple Choice)
4.8/5 (36)
The simple tabulation and cross-tabulation are tabular methods that can be extended to include the mean or other measures of a selected quantitative variable for persons or items within a category or combination of categories.
(True/False)
4.8/5 (33)
The ages for a sample of 25 car dealers are as follows:
30 40 31 41 53 37 54 28 45 30 45 21 32 34 26 34 24 24 35 47 38 45 28 43 35 Use Minitab to draw each of the following graphs.
a.A stem and leaf plot
b.a dot plot
(Essay)
4.9/5 (32)
A histogram describes a frequency distribution by using a series of adjacent rectangles,each of which has a length that is proportional to the frequency of observations within the range of values it represents.
(True/False)
4.9/5 (28)
Filters
- Essay(0)
- Multiple Choice(0)
- Short Answer(0)
- True False(0)
- Matching(0)