Exam 18: Models for Time Series and Forecasting
Exam 1: A Preview of Business Statistics55 Questions
Exam 2: Visual Description of Data67 Questions
Exam 3: Statistical Description of Data146 Questions
Exam 4: Data Collection and Sampling Methods104 Questions
Exam 5: Probability: Review of Basic Concepts188 Questions
Exam 6: Discrete Probability Distributions140 Questions
Exam 7: Continuous Probability Distributions160 Questions
Exam 8: Sampling Distributions108 Questions
Exam 9: Estimation From Sample Data150 Questions
Exam 10: Hypothesis Tests Involving a Sample Mean or Proportion170 Questions
Exam 11: Hypothesis Tests Involving Two Sample Means149 Questions
Exam 12: Analysis of Variance Tests173 Questions
Exam 13: Chi-Square Applications134 Questions
Exam 14: Nonparametric Methods139 Questions
Exam 15: Simple Linear Regression and Correlation145 Questions
Exam 16: Multiple Regression and Correlation98 Questions
Exam 17: Model Building83 Questions
Exam 18: Models for Time Series and Forecasting127 Questions
Exam 19: Decision Theory82 Questions
Exam 20: Total Quality Management132 Questions
Select questions type
Cell Phones
The number of peak cell-phones minutes used each month by a particular person is shown in the table below:
Manth Minutas 1 74 2 86 3 70 4 96 5 111 6 102 7 115 126
-What is the linear trend equation?
(Essay)
4.8/5  (33)
(33)
Highland Automotvie
The table below summarizes the number of new cars Highland Automotive sold during each of the last five weeks along with a forecast that was generated for each of those weeks.
Week Number af Cars 5ald Farecast 1 24 20 2 21 22 3 25 21 4 19 23 5 34 21
-What is the mean absolute deviation for this forecast?
(Short Answer)
4.9/5 (34)
In determining weekly seasonal indexes for electrical consumption,the sum of the 52 means for electrical consumption as a percentage of the moving average is 5193.To get the seasonal indexes,each monthly mean is to be multiplied by ____________________________________.
(Short Answer)
4.9/5 (39)
In de-seasonalizing a time series,we remove the seasonal influences and generate a time series that is said to be seasonally adjusted.
(True/False)
4.8/5 (35)
By analyzing a time series,we can identify patterns and tendencies that help explain variation in past sales,shipments,rainfall,or any other variable of interest.
(True/False)
4.8/5 (44)
The following trend line was calculated from quarterly data for 1996 - 2000: = 0.70 + 0.005t,where t = 1 for the first quarter of 1996.The seasonal indexes computed from the trend line for the four quarters of the year 2001 were 0.85,1.05,1.15,and 0.80,respectively.What is the seasonalized forecast for the third quarter of the year 2001?
(Short Answer)
4.8/5 (32)
Five trend models for the same time series data are compared and the MSE values are 35,9,15,118,and 25.The worst fitting model to the data is the one whose MSE is ____________________.
(Short Answer)
4.8/5 (41)
In determining monthly seasonal indexes for gas consumption,the sum of the 12 means for gas consumption as a percentage of the moving average is 1150.To get the seasonal indexes,each of the 12 monthly means is to be multiplied by:
(Multiple Choice)
4.8/5 (34)
The trend equation = 1300 + 25x has been fitted to a time series for auto industry worker days lost due to job-related injuries.If x = 1 for 1999,estimate the number of worker days lost during 2010.
(Short Answer)
4.8/5 (38)
The seasonal indexes for a convention center's bookings are 85,128,104,and 83 for quarters 1 through 4,respectively.What percentage of the center's annual bookings tend to occur during the second quarter?
(Short Answer)
4.8/5 (32)
How do the MAD and MSE criteria differ in their approach to evaluating the fit of an estimation equation to a time series?
(Essay)
4.8/5 (33)
In general,the most important component of most time series is the irregular,which can be examined by using regression techniques.
(True/False)
4.9/5 (37)
The trend equation for quarter sales data (in millions of dollars)for 1996-2000 is = 6.8 + 1.2t,where t = 1 for the first quarter of 1996.If the seasonal index for the third quarter of 2001 is 1.25,then the forecasted sales for the third quarter of 2001 is:
(Multiple Choice)
4.7/5 (39)
Daily sales volume from the Avalon Convenience Store is shown in the table below.
Day Sales () 1 512 2 328 3 538 4 662 5 498 6 546 7 579 8 595 9 616 10 655 What is the linear trend estimate for Day 4?
(Short Answer)
4.8/5 (35)
The smoothing techniques,such as moving average or exponential smoothing,function much like the shock absorbers of an automobile; damping the sudden upward and downward "jolts" that occur over the series.
(True/False)
4.8/5 (32)
The regression output produced by MINITAB for times series set of data is shown below: The regression equation is
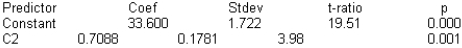 Analysis of Variance
SOURCE DF SS MS F p Regression 1 170.83 170.83 15.85 0.001 Error 14 150.92 10.78 Total 15 321.75
Durbin-Watson statistic Test for positive autocorrelation using a 0.05 significance level.
Test statistic = ____________________
Critical Value = ____________________
Conclusion: ____________________
Interpretation: __________________________________________________
Analysis of Variance
SOURCE DF SS MS F p Regression 1 170.83 170.83 15.85 0.001 Error 14 150.92 10.78 Total 15 321.75
Durbin-Watson statistic Test for positive autocorrelation using a 0.05 significance level.
Test statistic = ____________________
Critical Value = ____________________
Conclusion: ____________________
Interpretation: __________________________________________________
(Essay)
4.9/5 (26)
Susan Young
Susan Young is a college student who has just completed her junior year.The table below summarizes her Grade Point Average (GPA)for each of the last nine semesters.
Year Semaster CPA Freshman Fall 2.5 Winter 2.8 Spring 2.6 Sophomore Fall 2.4 Winter 3.1 Spring 2.8 Junior Fall 2.6 Winter 3.5 Spring 3.1
-What is the linear trend estimate for Susan's GPA for Spring semester Sophomore year?
(Short Answer)
4.9/5 (33)
____________________ are measures intended to reflect the extent to which various parts of the year experience higher or lower levels of production,demand,or other kinds of economic activity.
(Short Answer)
4.9/5 (40)
The upsurge in school supply sales in the fall of each year is an example of the:
(Multiple Choice)
4.9/5 (33)
Filters
- Essay(0)
- Multiple Choice(0)
- Short Answer(0)
- True False(0)
- Matching(0)