Exam 2: Organising and Visualising Data
Exam 1: Defining and Collecting Data145 Questions
Exam 2: Organising and Visualising Data203 Questions
Exam 3: Numerical Descriptive Measures147 Questions
Exam 4: Basic Probability168 Questions
Exam 5: Some Important Discrete Probability Distributions172 Questions
Exam 6: The Normal Distribution and Other Continuous Distributions190 Questions
Exam 7: Sampling Distributions133 Questions
Exam 8: Confidence Interval Estimation186 Questions
Exam 9: Fundamentals of Hypothesis Testing: One-Sample Tests180 Questions
Exam 10: Hypothesis Testing: Two-Sample Tests175 Questions
Exam 11: Analysis of Variance148 Questions
Exam 12: Simple Linear Regression207 Questions
Exam 13: Introduction to Multiple Regression269 Questions
Exam 14: Time-Series Forecasting and Index Numbers201 Questions
Exam 15: Chi-Square Tests134 Questions
Exam 16: Multiple Regression Model Building93 Questions
Exam 17: Decision Making106 Questions
Exam 18: Statistical Applications in Quality Management119 Questions
Exam 19: Further Non-Parametric Tests50 Questions
Select questions type
Instruction 2.9
A sample of 200 students at a large university was taken after the final exam to ask them whether they went out on the weekend before the exam or spent the weekend studying, and whether they did well or poorly on the exam. The following table contains the result.
Did Well on Exam Did Poorly on Exam Studying for Exam 80 20 Went out on the weekend 30 70
-Referring to Instruction 2.9,_________ % of the students in the sample went out on the weekend before the exam and did well on the exam.
(Multiple Choice)
4.9/5  (43)
(43)
A scatter diagram can be used to examine the relationship between price (independent variable)and the quantity sold at a market (dependent variable).
(True/False)
4.7/5 (41)
When studying the simultaneous responses to two categorical questions,we should set up a
(Multiple Choice)
4.9/5 (41)
Figure 2.2
The histogram below represents scores achieved by 200 job applicants on a personality profile. 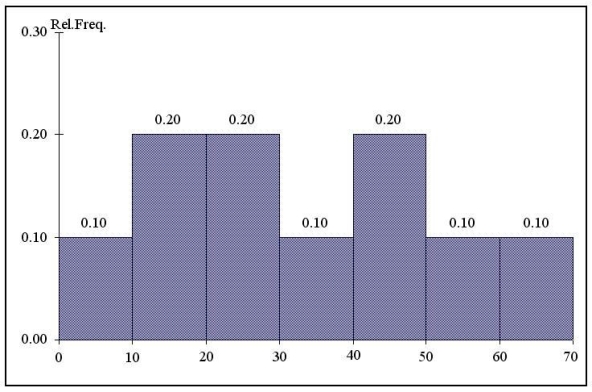 -Referring to the histogram from Figure 2.2,_________ % of the applicants scored below 20 or at least 50.
(Short Answer)
4.7/5 (43)
You have collected data on the responses to two questions asked in a survey of 40 college students majoring in business studies - What is your gender (Male = M; Female = F)and What is your major (Accountancy = A; Computer Information Systems = C; Marketing = M).Which of the following is the best for presenting the data?
(Multiple Choice)
4.8/5 (45)
Instruction 2.11
The table below contains the number of people who own a portable DVD player in a sample of 600 broken down by gender.
Own a Portable DVD Player Male Fermale Yes 96 40 No 224 240
-Referring to Instruction 2.11,if the sample is a good representation of the population,we can expect _________%t of the males in the population will own a portable DVD.
(Short Answer)
4.8/5 (35)
Facebook collected information on the age of their users.The youngest user was 13 and the oldest was 96.To study the distribution of the age among its users,it can use a percentage polygon.
(True/False)
4.8/5 (47)
The point halfway between the boundaries of each class interval in a grouped frequency distribution is called the _________.
(Short Answer)
4.7/5 (49)
Instruction 2.10
The table below contains the opinions of a sample of 200 people broken down by gender about the latest government plan to eliminate restraint of trade exemptions for professional sporting leagues.
For Netural Ageinst Totals Female 38 54 12 104 Male 12 39 48 96 Totals 50 60 200
-Referring to Instruction 2.10,of the males in the sample,_________% were for the plan.
(Short Answer)
4.9/5 (45)
Which of the following is not a guideline for presenting good graphs?
(Multiple Choice)
4.8/5 (45)
Instruction 2.11
The table below contains the number of people who own a portable DVD player in a sample of 600 broken down by gender.
Own a Portable DVD Player Male Fermale Yes 96 40 No 224 240
-Referring to Instruction 2.11,of the males in the sample,_________% owned a portable DVD.
(Short Answer)
4.8/5 (37)
The stem-and-leaf display is often superior to the frequency distribution in that it maintains the original values for further analysis.
(True/False)
4.8/5 (35)
Instruction 2.5
The Stem-and-Leaf display below contains data on the number of months between the date a civil suit is filed and when the case is actually adjudicated for 50 cases heard in the Supreme Court of Victoria.
Stem Leaves 1 23444 1 7899 2 2222345 5 2 678889 3 001113 3 5778 4 0234 4 5579 5 1124 5 66 6 15 6 8 Note: 1L means the 'low teens' - 10, 11, 12, 13, or 14; 1H means the 'high teens' - 15, 16, 17, 18, or 19; 2L means the 'low twenties' - 20, 21, 22, 23, or 24, etc.
-Referring to Instruction 2.5,if a frequency distribution with equal-sized classes was made from this data,and the first class was '10 but less than 20',the frequency of that class would be_________.
(Short Answer)
4.8/5 (36)
The simplest possible graph is not always the best graph to use for a given set of data.
(True/False)
4.9/5 (36)
Instruction 2.5
The Stem-and-Leaf display below contains data on the number of months between the date a civil suit is filed and when the case is actually adjudicated for 50 cases heard in the Supreme Court of Victoria.
Stem Leaves 1 23444 1 7899 2 2222345 5 2 678889 3 001113 3 5778 4 0234 4 5579 5 1124 5 66 6 15 6 8 Note: 1L means the 'low teens' - 10, 11, 12, 13, or 14; 1H means the 'high teens' - 15, 16, 17, 18, or 19; 2L means the 'low twenties' - 20, 21, 22, 23, or 24, etc.
-Referring to Instruction 2.5,_________ % of the cases were adjudicated within the first two years.
(Short Answer)
4.8/5 (42)
Instruction 2.5
The Stem-and-Leaf display below contains data on the number of months between the date a civil suit is filed and when the case is actually adjudicated for 50 cases heard in the Supreme Court of Victoria.
Stem Leaves 1 23444 1 7899 2 2222345 5 2 678889 3 001113 3 5778 4 0234 4 5579 5 1124 5 66 6 15 6 8 Note: 1L means the 'low teens' - 10, 11, 12, 13, or 14; 1H means the 'high teens' - 15, 16, 17, 18, or 19; 2L means the 'low twenties' - 20, 21, 22, 23, or 24, etc.
-Referring to Instruction 2.5,if a frequency distribution with equal-sized classes was made from this data,and the first class was '0 but less than 10',the frequency of the fifth class would be _________.
(Short Answer)
4.8/5 (41)
Instruction 2.10
The table below contains the opinions of a sample of 200 people broken down by gender about the latest government plan to eliminate restraint of trade exemptions for professional sporting leagues.
For Netural Ageinst Totals Female 38 54 12 104 Male 12 39 48 96 Totals 50 60 200
-Referring to Instruction 2.10,_________ % of the 200 were females who were either neutral or against the plan.
(Short Answer)
4.7/5 (36)
When using business analytics methods such as treemaps,gauges,and bullet graphs,colour spectrums that run from _________ should be avoided.
(Multiple Choice)
4.8/5 (37)
You have collected data on the number of complaints for six different brands of automobiles sold in Australia in 2012 and in 2018.Which of the following is the best for presenting the data?
(Multiple Choice)
4.9/5 (31)
Instruction 2.9
A sample of 200 students at a large university was taken after the final exam to ask them whether they went out on the weekend before the exam or spent the weekend studying, and whether they did well or poorly on the exam. The following table contains the result.
Did Well on Exam Did Poorly on Exam Studying for Exam 80 20 Went out on the weekend 30 70
-Referring to Instruction 2.9,if the sample is a good representation of the population,we can expect _________ %of the students in the population to spend the weekend studying and do poorly on the exam.
(Multiple Choice)
4.9/5 (40)
Filters
- Essay(0)
- Multiple Choice(0)
- Short Answer(0)
- True False(0)
- Matching(0)