Exam 2: Organising and Visualising Data
Exam 1: Defining and Collecting Data145 Questions
Exam 2: Organising and Visualising Data203 Questions
Exam 3: Numerical Descriptive Measures147 Questions
Exam 4: Basic Probability168 Questions
Exam 5: Some Important Discrete Probability Distributions172 Questions
Exam 6: The Normal Distribution and Other Continuous Distributions190 Questions
Exam 7: Sampling Distributions133 Questions
Exam 8: Confidence Interval Estimation186 Questions
Exam 9: Fundamentals of Hypothesis Testing: One-Sample Tests180 Questions
Exam 10: Hypothesis Testing: Two-Sample Tests175 Questions
Exam 11: Analysis of Variance148 Questions
Exam 12: Simple Linear Regression207 Questions
Exam 13: Introduction to Multiple Regression269 Questions
Exam 14: Time-Series Forecasting and Index Numbers201 Questions
Exam 15: Chi-Square Tests134 Questions
Exam 16: Multiple Regression Model Building93 Questions
Exam 17: Decision Making106 Questions
Exam 18: Statistical Applications in Quality Management119 Questions
Exam 19: Further Non-Parametric Tests50 Questions
Select questions type
Given below is the scatter plot of the market value (thousands$)and profit (thousands$)of 50 Australian companies.Higher market values appear to be associated with higher profits. 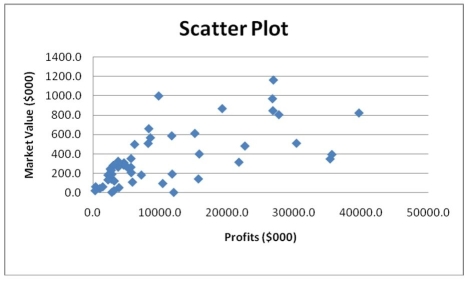
(True/False)
4.8/5  (36)
(36)
Sarah is reviewing a report on her company's annual performance.In the report,the key indicators are visualized using devices that resemble a car's speedometer.The report Sarah is reviewing uses _________to present data.
(Short Answer)
4.8/5 (39)
Instruction 2.6
The frequency distribution below represents the rents of 250 randomly selected federally subsidised apartments in Sydney.
Rent in \ Frequency 300 but less than 400 113 400 but less than 500 85 500 but less than 600 32 600 but less than 700 16 700 but less than 800 4
-Referring to Instruction 2.6,the percentage of apartments renting for less than $600 is _________.
(Short Answer)
4.8/5 (28)
Instruction 2.4
The following are the durations in minutes of a sample of long-distance phone calls made within Australia reported by one long-distance carrier.
Time (in Minutes) Relative Frequency 0 but less than 5 0.37 5 but less than 10 0.22 10 but less than 15 0.15 15 but less than 20 0.10 20 but less than 25 0.07 25 but less than 30 0.07 30 or more 0.02
-Referring to Instruction 2.4,if 100 calls were sampled,_________ of them would have lasted 20 minutes or more.
(Multiple Choice)
4.9/5 (33)
Instruction 2.9
A sample of 200 students at a large university was taken after the final exam to ask them whether they went out on the weekend before the exam or spent the weekend studying, and whether they did well or poorly on the exam. The following table contains the result.
Did Well on Exam Did Poorly on Exam Studying for Exam 80 20 Went out on the weekend 30 70
-Referring to Instruction 2.9,of those who did well on the exam in the sample,_________ % of them went out on the weekend before the exam.
(Multiple Choice)
4.9/5 (39)
Instruction 2.10
The table below contains the opinions of a sample of 200 people broken down by gender about the latest government plan to eliminate restraint of trade exemptions for professional sporting leagues.
For Netural Ageinst Totals Female 38 54 12 104 Male 12 39 48 96 Totals 50 60 200
-Referring to Instruction 2.10,_________% of the 200 were males.
(Short Answer)
4.8/5 (39)
Inappropriate graphs raise _________concerns,especially when they,deliberately or not,present a false impression of the data.
(Short Answer)
5.0/5 (44)
Data on the number of part-time hours students at a public university worked in a week were collected.Which of the following is the best chart for presenting the information?
(Multiple Choice)
4.9/5 (36)
Instruction 2.11
The table below contains the number of people who own a portable DVD player in a sample of 600 broken down by gender.
Own a Portable DVD Player Male Fermale Yes 96 40 No 224 240
-Referring to Instruction 2.11,_________ % of the 600 were females who owned a portable DVD.
(Short Answer)
4.9/5 (32)
Instruction 2.11
The table below contains the number of people who own a portable DVD player in a sample of 600 broken down by gender.
Own a Portable DVD Player Male Fermale Yes 96 40 No 224 240
-Referring to Instruction 2.11,_________% of the 600 owned a portable DVD.
(Short Answer)
4.9/5 (45)
Instruction 2.6
The frequency distribution below represents the rents of 250 randomly selected federally subsidised apartments in Sydney.
Rent in \ Frequency 300 but less than 400 113 400 but less than 500 85 500 but less than 600 32 600 but less than 700 16 700 but less than 800 4
-Referring to Instruction 2.6,_________% of the apartments rented for no less than $600.
(Short Answer)
4.9/5 (44)
Instruction 2.10
The table below contains the opinions of a sample of 200 people broken down by gender about the latest government plan to eliminate restraint of trade exemptions for professional sporting leagues.
For Netural Ageinst Totals Female 38 54 12 104 Male 12 39 48 96 Totals 50 60 200
-Referring to Instruction 2.10,_________% of the 200 were not neutral.
(Short Answer)
4.8/5 (40)
Instruction 2.2
At a meeting of information systems officers for regional offices of a national company, a survey was taken to determine the number of employees the officers supervise in the operation of their departments, where X is the number of employees overseen by each information systems officer.
x f 1 7 2 5 3 11 4 8 5 9
-Referring to Instruction 2.2,how many regional offices are represented in the survey results?
(Multiple Choice)
4.8/5 (29)
Instruction 2.11
The table below contains the number of people who own a portable DVD player in a sample of 600 broken down by gender.
Own a Portable DVD Player Male Fermale Yes 96 40 No 224 240
-Referring to Instruction 2.11,of those who owned a portable DVD in the sample,_________ % were females.
(Short Answer)
4.8/5 (40)
Instruction 2.9
A sample of 200 students at a large university was taken after the final exam to ask them whether they went out on the weekend before the exam or spent the weekend studying, and whether they did well or poorly on the exam. The following table contains the result.
Did Well on Exam Did Poorly on Exam Studying for Exam 80 20 Went out on the weekend 30 70
-Referring to Instruction 2.9,if the sample is a good representation of the population,we can expect _________% of those who spent the weekend studying to do poorly on the exam.
(Multiple Choice)
4.9/5 (42)
Histograms are used for numerical data while bar charts are suitable for categorical data.
(True/False)
4.8/5 (32)
You have collected data on the monthly seasonally adjusted unemployment rate for Australia from 2010 to 2018.Which of the following is the best for presenting the data?
(Multiple Choice)
4.9/5 (41)
Instruction 2.1
An insurance company evaluates many numerical variables about a person before deciding on an appropriate rate for automobile insurance. A representative from a local insurance agency selected a random sample of insured drivers and recorded, X, the number of claims each made in the last three years, with the following results.
X f 1 14 2 18 3 12 4 5 5 1
-Referring to Instruction 2.1,how many total claims are represented in the sample?
(Multiple Choice)
4.8/5 (28)
Instruction 2.5
The Stem-and-Leaf display below contains data on the number of months between the date a civil suit is filed and when the case is actually adjudicated for 50 cases heard in the Supreme Court of Victoria.
Stem Leaves 1 23444 1 7899 2 2222345 5 2 678889 3 001113 3 5778 4 0234 4 5579 5 1124 5 66 6 15 6 8 Note: 1L means the 'low teens' - 10, 11, 12, 13, or 14; 1H means the 'high teens' - 15, 16, 17, 18, or 19; 2L means the 'low twenties' - 20, 21, 22, 23, or 24, etc.
-Referring to Instruction 2.5,if a frequency distribution with equal-sized classes was made from this data,and the first class was '10 but less than 20',the relative frequency of the third class would be _________.
(Short Answer)
4.7/5 (33)
When polygons or histograms are constructed,which axis must show the true zero or 'origin'?
(Multiple Choice)
4.8/5 (38)
Filters
- Essay(0)
- Multiple Choice(0)
- Short Answer(0)
- True False(0)
- Matching(0)