Exam 2: Organising and Visualising Data
Exam 1: Defining and Collecting Data145 Questions
Exam 2: Organising and Visualising Data203 Questions
Exam 3: Numerical Descriptive Measures147 Questions
Exam 4: Basic Probability168 Questions
Exam 5: Some Important Discrete Probability Distributions172 Questions
Exam 6: The Normal Distribution and Other Continuous Distributions190 Questions
Exam 7: Sampling Distributions133 Questions
Exam 8: Confidence Interval Estimation186 Questions
Exam 9: Fundamentals of Hypothesis Testing: One-Sample Tests180 Questions
Exam 10: Hypothesis Testing: Two-Sample Tests175 Questions
Exam 11: Analysis of Variance148 Questions
Exam 12: Simple Linear Regression207 Questions
Exam 13: Introduction to Multiple Regression269 Questions
Exam 14: Time-Series Forecasting and Index Numbers201 Questions
Exam 15: Chi-Square Tests134 Questions
Exam 16: Multiple Regression Model Building93 Questions
Exam 17: Decision Making106 Questions
Exam 18: Statistical Applications in Quality Management119 Questions
Exam 19: Further Non-Parametric Tests50 Questions
Select questions type
Arnold would like to view up-to-the-minute operational status indicators about his business,such as number of purchases,daily sales figures,and stock information.Which of the following should he use?
(Multiple Choice)
4.8/5  (40)
(40)
An economist is evaluating the relationship between the inflation rates for Australia and New Zealand.Which of the following is the best for presenting the data?
(Multiple Choice)
4.7/5 (33)
You have collected data on the number of households in Sydney actively using online banking and/or online bill payment from 2000 to 2018.Which of the following is the best for presenting the data?
(Multiple Choice)
4.8/5 (38)
Figure 2.2
The histogram below represents scores achieved by 200 job applicants on a personality profile. 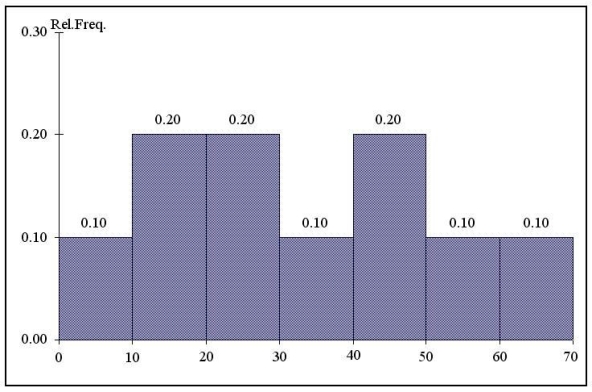 -Referring to the histogram from Figure 2.2,_________ %t of the job applicants scored below 50.
(Short Answer)
4.8/5 (34)
Which one of the following is not a guideline for presenting good graphs?
(Multiple Choice)
4.8/5 (33)
Instruction 2.11
The table below contains the number of people who own a portable DVD player in a sample of 600 broken down by gender.
Own a Portable DVD Player Male Fermale Yes 96 40 No 224 240
-Referring to Instruction 2.11,construct a table of total percentages.
(Essay)
4.9/5 (40)
Instruction 2.10
The table below contains the opinions of a sample of 200 people broken down by gender about the latest government plan to eliminate restraint of trade exemptions for professional sporting leagues.
For Netural Ageinst Totals Female 38 54 12 104 Male 12 39 48 96 Totals 50 60 200
-Referring to Instruction 2.10,if the sample is a good representation of the population,we can expect _________% of the population will be for the plan.
(Short Answer)
4.8/5 (38)
Instruction 2.8
Given below is the stem-and-leaf display representing the amount of detergent used in litres (with leaves in 10ths of litres) in a month by 25 drive-through car wash operations in Auckland.
Stem Leaves 9 147 10 02238 11 135566777 12 223489 13 02
-Referring to Instruction 2.8,construct a relative frequency or percentage distribution for the detergent data,using '9.0 but less than 9.9' as the first class.
(Essay)
4.9/5 (49)
Instruction 2.8
Given below is the stem-and-leaf display representing the amount of detergent used in litres (with leaves in 10ths of litres) in a month by 25 drive-through car wash operations in Auckland.
Stem Leaves 9 147 10 02238 11 135566777 12 223489 13 02
-Referring to Instruction 2.8 if a relative frequency or percentage distribution for the detergent data is constructed,using '9.0 but less than 9.9 litres' as the first class,_________ % of drive-through car wash operations use at least 10 litres but no more than 13 litres of detergent in a month.
(Short Answer)
4.9/5 (38)
In constructing a polygon,each class grouping is represented by its _________ and then these are consecutively connected to one another.
(Short Answer)
4.9/5 (32)
Instruction 2.1
An insurance company evaluates many numerical variables about a person before deciding on an appropriate rate for automobile insurance. A representative from a local insurance agency selected a random sample of insured drivers and recorded, X, the number of claims each made in the last three years, with the following results.
X f 1 14 2 18 3 12 4 5 5 1
-Referring to Instruction 2.1,how many drivers are represented in the sample?
(Multiple Choice)
4.9/5 (35)
One of the guidelines for presenting good graphs is that the scale on the vertical axis should begin at zero.
(True/False)
4.9/5 (33)
Instruction 2.5
The Stem-and-Leaf display below contains data on the number of months between the date a civil suit is filed and when the case is actually adjudicated for 50 cases heard in the Supreme Court of Victoria.
Stem Leaves 1 23444 1 7899 2 2222345 5 2 678889 3 001113 3 5778 4 0234 4 5579 5 1124 5 66 6 15 6 8 Note: 1L means the 'low teens' - 10, 11, 12, 13, or 14; 1H means the 'high teens' - 15, 16, 17, 18, or 19; 2L means the 'low twenties' - 20, 21, 22, 23, or 24, etc.
-Referring to Instruction 2.5,if a frequency distribution with equal-sized classes was made from this data,and the first class was '10 but less than 20',the cumulative percentage of the second class would be _________.
(Short Answer)
5.0/5 (36)
Instruction 2.8
Given below is the stem-and-leaf display representing the amount of detergent used in litres (with leaves in 10ths of litres) in a month by 25 drive-through car wash operations in Auckland.
Stem Leaves 9 147 10 02238 11 135566777 12 223489 13 02
-Referring to Instruction 2.8,construct a percentage polygon for the detergent data if the corresponding frequency distribution uses '9.0 but less than 9.9' as the first class.
(Essay)
4.9/5 (41)
Instruction 2.1
An insurance company evaluates many numerical variables about a person before deciding on an appropriate rate for automobile insurance. A representative from a local insurance agency selected a random sample of insured drivers and recorded, X, the number of claims each made in the last three years, with the following results.
X f 1 14 2 18 3 12 4 5 5 1
-The length of each bar in a bar chart represents the
(Multiple Choice)
4.9/5 (36)
Instruction 2.10
The table below contains the opinions of a sample of 200 people broken down by gender about the latest government plan to eliminate restraint of trade exemptions for professional sporting leagues.
For Netural Ageinst Totals Female 38 54 12 104 Male 12 39 48 96 Totals 50 60 200
-Referring to Instruction 2.10,of those for the plan in the sample,_________ % were females.
(Short Answer)
4.9/5 (30)
Instruction 2.11
The table below contains the number of people who own a portable DVD player in a sample of 600 broken down by gender.
Own a Portable DVD Player Male Fermale Yes 96 40 No 224 240
-Referring to Instruction 2.11,construct a table of column percentages.
(Essay)
4.8/5 (39)
Figure 2.1
Every second semester, the School of Business at a large university coordinates with local business leaders at a luncheon for graduating students, their families, and friends. Corporate sponsorship pays for the lunches of each of the graduating students, but students have to purchase tickets to cover the cost of lunches served to guests they bring with them. The following histogram represents the attendance at the luncheon, where X is the number of guests each graduating student invited to the luncheon and f is the number of graduating students in each category. 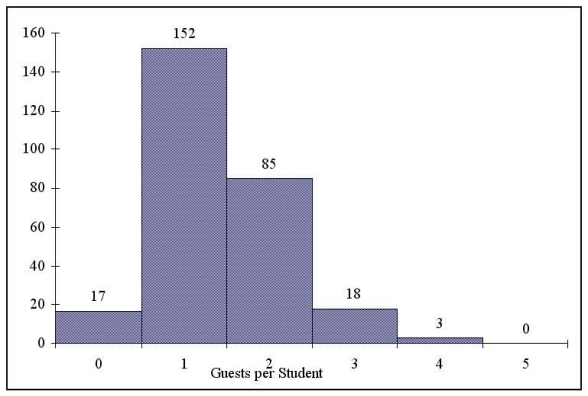 -Referring to the histogram from Figure 2.1,if all the tickets purchased were used,how many guests attended the luncheon?
(Multiple Choice)
4.8/5 (37)
Filters
- Essay(0)
- Multiple Choice(0)
- Short Answer(0)
- True False(0)
- Matching(0)