Exam 2: Organising and Visualising Data
Exam 1: Defining and Collecting Data145 Questions
Exam 2: Organising and Visualising Data203 Questions
Exam 3: Numerical Descriptive Measures147 Questions
Exam 4: Basic Probability168 Questions
Exam 5: Some Important Discrete Probability Distributions172 Questions
Exam 6: The Normal Distribution and Other Continuous Distributions190 Questions
Exam 7: Sampling Distributions133 Questions
Exam 8: Confidence Interval Estimation186 Questions
Exam 9: Fundamentals of Hypothesis Testing: One-Sample Tests180 Questions
Exam 10: Hypothesis Testing: Two-Sample Tests175 Questions
Exam 11: Analysis of Variance148 Questions
Exam 12: Simple Linear Regression207 Questions
Exam 13: Introduction to Multiple Regression269 Questions
Exam 14: Time-Series Forecasting and Index Numbers201 Questions
Exam 15: Chi-Square Tests134 Questions
Exam 16: Multiple Regression Model Building93 Questions
Exam 17: Decision Making106 Questions
Exam 18: Statistical Applications in Quality Management119 Questions
Exam 19: Further Non-Parametric Tests50 Questions
Select questions type
Figure 2.2
The histogram below represents scores achieved by 200 job applicants on a personality profile. 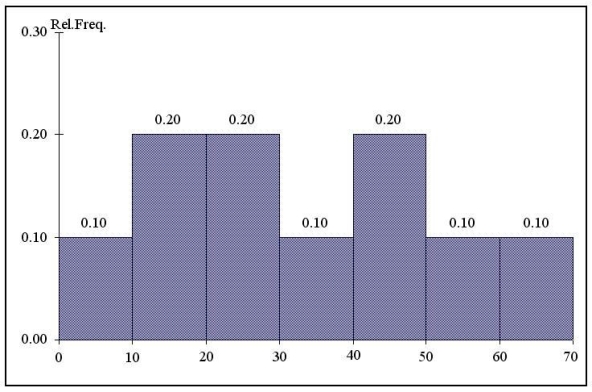 -Referring to the histogram from Figure 2.2,90% of the job applicants scored above or equal to _________.
(Short Answer)
4.9/5  (36)
(36)
The percentage polygon is formed by having the lower boundary of each class represent the data in that class and then connecting the sequence of lower boundaries at their respective class percentages.
(True/False)
4.7/5 (37)
Instruction 2.7
The ordered array below resulted from taking a sample of 25 batches of 500 computer chips and determining how many in each batch were defective.
Defeds 1 2 4 4 5 5 6 7 9 9 12 12 15 17 20 21 23 23 25 26 27 27 28 29 29
-Referring to Instruction 2.7,construct a histogram for the defects data,using '0 but less than 5' as the first class.
(Essay)
4.9/5 (37)
A _________is a summary table in which numerical data are tallied into class intervals or categories.
(Short Answer)
4.9/5 (31)
Relationships in a contingency table can be examined more fully if the frequencies are converted into_________.
(Short Answer)
4.9/5 (38)
Data on the number of credit hours of 20,000 students at a public university enrolled in the first semester were collected.Which of the following is the best for presenting the information?
(Multiple Choice)
5.0/5 (38)
A _________ is a vertical bar chart in which the rectangular bars are constructed at the boundaries of each class interval.
(Short Answer)
4.9/5 (41)
Instruction 2.4
The following are the durations in minutes of a sample of long-distance phone calls made within Australia reported by one long-distance carrier.
Time (in Minutes) Relative Frequency 0 but less than 5 0.37 5 but less than 10 0.22 10 but less than 15 0.15 15 but less than 20 0.10 20 but less than 25 0.07 25 but less than 30 0.07 30 or more 0.02
-Referring to Instruction 2.4,if 100 calls were randomly sampled,_________of them would have lasted at least 15 minutes but less than 20 minutes.
(Multiple Choice)
4.8/5 (45)
Instruction 2.5
The Stem-and-Leaf display below contains data on the number of months between the date a civil suit is filed and when the case is actually adjudicated for 50 cases heard in the Supreme Court of Victoria.
Stem Leaves 1 23444 1 7899 2 2222345 5 2 678889 3 001113 3 5778 4 0234 4 5579 5 1124 5 66 6 15 6 8 Note: 1L means the 'low teens' - 10, 11, 12, 13, or 14; 1H means the 'high teens' - 15, 16, 17, 18, or 19; 2L means the 'low twenties' - 20, 21, 22, 23, or 24, etc.
-Referring to Instruction 2.5,_________of the 100 members visited the health club no more than 12 times in a year.
(Short Answer)
4.7/5 (38)
To present a good graph,one should avoid including _________ that will reduce the clarity of the graph.
(Short Answer)
4.8/5 (45)
If the values of the seventh and eighth class in a cumulative frequency distribution are the same,we know that there are no observations in the eighth class.
(True/False)
4.7/5 (43)
Instruction 2.11
The table below contains the number of people who own a portable DVD player in a sample of 600 broken down by gender.
Own a Portable DVD Player Male Fermale Yes 96 40 No 224 240
-Referring to Instruction 2.11,if the sample is a good representation of the population,we can expect _________%t of the population will be males.
(Short Answer)
4.9/5 (38)
Drill-down is a method of data discovery that involves revealing data that underlie a higher-level summary.
(True/False)
4.9/5 (39)
To determine the width of class interval,divide the number of class groups by the range of the data.
(True/False)
4.8/5 (33)
Instruction 2.7
The ordered array below resulted from taking a sample of 25 batches of 500 computer chips and determining how many in each batch were defective.
Defeds 1 2 4 4 5 5 6 7 9 9 12 12 15 17 20 21 23 23 25 26 27 27 28 29 29
-Referring to Instruction 2.7,construct a relative frequency or percentage distribution for the defects data,using '0 but less than 5' as the first class.
(Essay)
4.8/5 (36)
Instruction 2.11
The table below contains the number of people who own a portable DVD player in a sample of 600 broken down by gender.
Own a Portable DVD Player Male Fermale Yes 96 40 No 224 240
-Referring to Instruction 2.11,if the sample is a good representation of the population,we can expect _________% of the population will own a portable DVD.
(Short Answer)
4.8/5 (28)
When comparing two or more large batches of numerical data,the distributions being developed should use the same _________.
(Short Answer)
4.8/5 (38)
Instruction 2.4
The following are the durations in minutes of a sample of long-distance phone calls made within Australia reported by one long-distance carrier.
Time (in Minutes) Relative Frequency 0 but less than 5 0.37 5 but less than 10 0.22 10 but less than 15 0.15 15 but less than 20 0.10 20 but less than 25 0.07 25 but less than 30 0.07 30 or more 0.02
-Referring to Instruction 2.4,what is the width of each class?
(Multiple Choice)
5.0/5 (42)
Instruction 2.7
The ordered array below resulted from taking a sample of 25 batches of 500 computer chips and determining how many in each batch were defective.
Defeds 1 2 4 4 5 5 6 7 9 9 12 12 15 17 20 21 23 23 25 26 27 27 28 29 29
-Referring to Instruction 2.7,construct a cumulative percentage distribution for the defects data if the corresponding frequency distribution uses '0 but less than 5' as the first class.
(Essay)
4.7/5 (37)
In general,a frequency distribution should have at least eight class groups but no more than 20.
(True/False)
4.9/5 (31)
Filters
- Essay(0)
- Multiple Choice(0)
- Short Answer(0)
- True False(0)
- Matching(0)