Exam 20: Simulation
Suppose that random observations are needed from the triangular distribution whose probability density function is  (a)Derive an expression for each random observation as a function of the uniform random number r.(b)Generate five random observations for this distribution by using the following uniform random numbers: 0.0956,0.5629,0.6695,0.7634,0.8426.(c)The inverse transformation method was applied to generate the following three random observations from this distribution: 0.09,0.64,0.49.Identify the three uniform random numbers that were used.d)Write an equation that Excel can use to generate each random observation from this distribution.
(a)Applying the inverse transformation method, 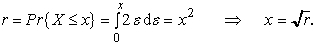 (b)Applying the formula obtained in part (a)yields the following random observations.
  (c)From part (a),we have r = x2,which yields the following uniform random numbers.
  (d)The equation that Excel can use is =SQRT(RAND()).
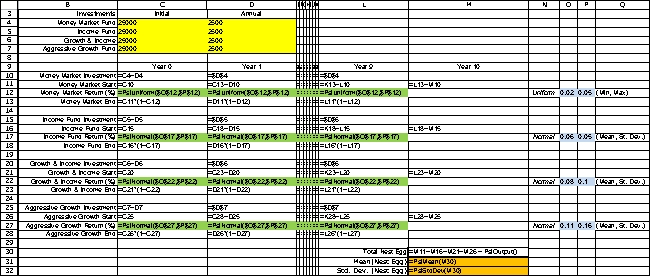
Patrick Gordon is ten years away from retirement.He has accumulated a $100,000 nest egg that he would like to invest for his golden years.Furthermore,he is confident that he can invest $10,000 more each year until retirement.He is curious about what kind of nest egg he can expect to have accumulated at retirement ten years from now.Patrick plans to split his investments evenly among four investments: a Money Market Fund,a Domestic Stock Fund,a Global Stock Fund,and an Aggressive Growth Fund.Based on past performance,Patrick expects each of these funds to earn a return in each of the upcoming ten years according to the distributions shown in the following table.  Assume that the initial nest egg ($100,000)and the first year's investment ($10,000)are made right now (year 0)and are split evenly among the four funds (i.e.,$27,500 in each fun d)in the same fund and no redistribution will be done before retirement.Furthermore,nine additional investments of $10,000 will be made and split evenly among the four funds ($2,500 each)at year 1,year 2,...,year 9.A financial advisor has told Patrick that he can retire comfortably if he can accumulate $300,000 by year 10 to supplement his other sources of retirement income.Use a 1000-trial ASPE simulation to estimate each of the following.The uncertain elements in this problem are the annual return of each investment over the next 10 years (Year 0 through Year 9).To simulate this,we define an uncertain variable cell for the annual return of each investment in each year.These cells are defined in rows 12,17,22,and 27 of the spreadsheet below.To track the investments,we calculate their balances in each year.Row 10,15,20,and 25 show the investment made by Patrick in each year.Rows 11,16,21,and 26 calculate the balance in each fund at the start of the year.For Year 0 in each fund,this will simply be the initial investment ($25,000)plus the annual investment ($2,500).For each future year,it will be the balance at the end of the preceding year plus the annual investment.For example,for Year 1 of the money market fund,the starting balance is D11 = C13 + D10.Rows 13,18,23,and 28 calculate the year-end balance for each fund.This will be the starting balance times the net return.For example,for the money market fund in Year 0 this will be C13 = C11*(1+C12).Finally,the Year 10 totals are added up in M30 to calculate Patrick's final nest egg.This cell is defined as a results cell in ASPE.Two statistic cells are defined in M31 and M32 to estimate the mean and standard deviation of the final nest egg.
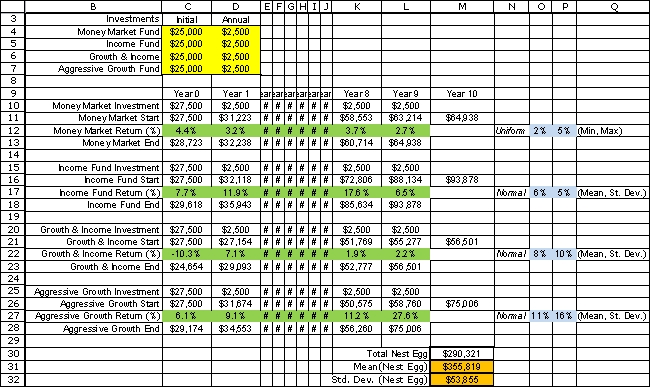
 The results of a 1000-trial simulation run are shown below.
 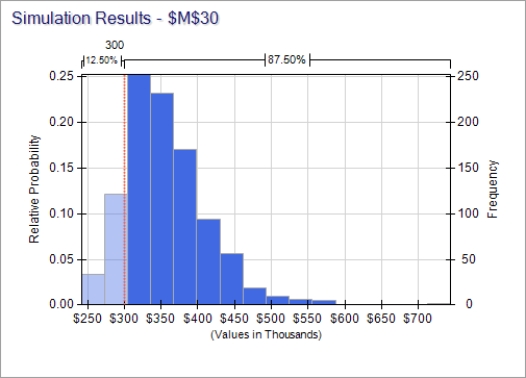 (a)What will be the expected value (mean)of Patrick's nest egg at year 10? (b)What will be the standard deviation of Patrick's nest egg at year 10? (c)What is the probability that the total nest egg at year 10 will be at least $300,000? d).The returns of each fund are allowed to accumulate (i.e.,are re-investe)
(a)The first spreadsheet above says the mean of the nest egg at year 10 is nearly $356 thousand.(b)This spreadsheet says the standard deviation of Patrick's nest egg at year 10 is nearly $54 thousand.(c)The top of the above graph indicates that the requested probability is 0.875.
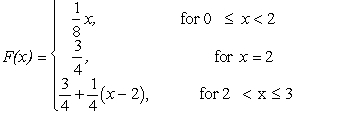
The random variable X has the cumulative distribution function F(x)whose value or derivative  is shown below for various values of x.F(0)= 0,
  =
=  ,for 0 < x < 2,P(X = 2)=
  ,so F(2)=
  ,
,  =
=  ,for 2 < x < 3,F(3)= 1.Generate four random observations from this probability distribution by using the following uniform random numbers:
  .Also calculate the sample average and compare it with the true mean
  for this probability distribution.
 Applying the inverse transformation method,we use a uniform random number r between 0 and 1,set F(x)= r and solve for x,which then is the desired random observation.For 0 ≤ x < 2,setting
  yields x = 8r for
  .Because
  ,we have x = 2 for
  .For 2 < x ≤ 3,setting
 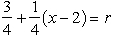 yields x = 4r - 1 for
  .To summarize,the random observation x generated by the uniform random number r is
 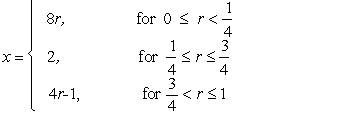 Hence,when
  ,we have
  with average = 33/16,which is slightly above the mean of 15/8.
The employees of General Manufacturing Corp.receive health insurance through a group plan issued by Wellnet.During the past year,40 percent of the employees did not file any health insurance claims,40 percent filed only a small claim,and 20 percent filed a large claim.The small claims were spread uniformly between 0 and $2,000,whereas the large claims were spread uniformly between $2,000 and $20,000.Based on this experience,Wellnet now is negotiating the corporation's premium payment per employee for the upcoming year.You are an operations research analyst for the insurance carrier,and you have been assigned the task of estimating the average cost of insurance coverage for the corporation's employees.(a)Use the random numbers 0.4071,0.5228,0.8185,0.5802,and 0.0193 to simulate whether each of five employees files no claim,a small claim,or a large claim.Then use the random numbers 0.9823,0.0188,0.8771,0.9872,and 0.4129 to simulate the size of the claim (including zero if no claim was file d).Calculate the average of these claims to estimate the mean of the overall distribution of the size of employee's health insurance claims.(b)Formulate and apply a spreadsheet model to simulate the cost for 300 employees' health insurance claims.Calculate the average of these random observations.(c)The true mean of the overall probability distribution of the size of an employee's health insurance claim is $2,600.Compare the estimates of this mean obtained in parts a and b with the true mean of the distribution.
Filters
- Essay(0)
- Multiple Choice(0)
- Short Answer(0)
- True False(0)
- Matching(0)