Exam 10: Comparisons Involving Means, Experimental Design and Analysis of Variance
Exam 1: Data and Statistics104 Questions
Exam 2: Descriptive Statistics: Tabular and Graphical Presentations65 Questions
Exam 3: Descriptive Statistics: Numerical Measures162 Questions
Exam 4: Introduction to Probability146 Questions
Exam 5: Discrete Probability Distributions121 Questions
Exam 6: Continuous Probability Distributions165 Questions
Exam 7: Sampling and Sampling Distributions131 Questions
Exam 8: Interval Estimation131 Questions
Exam 9: Hypothesis Tests136 Questions
Exam 10: Comparisons Involving Means, Experimental Design and Analysis of Variance208 Questions
Exam 11: Comparisons Involving Proportions and a Test of Independence94 Questions
Exam 12: Simple Linear Regression140 Questions
Exam 13: Multiple Regression146 Questions
Select questions type
Exhibit 10-11
To test whether or not there is a difference between treatments A, B, and C, a sample of 12 observations has been randomly assigned to the 3 treatments. You are given the results below.
 -Refer to Exhibit 10-11. The mean square within treatments (MSE) equals
(Multiple Choice)
4.9/5  (35)
(35)
Consider the following results for two samples randomly taken from two populations.
 a.Determine the degrees of freedom for the t distribution.
b.Develop a 95% confidence interval for the difference between the two population means.
c.Is there conclusive evidence that one population has a larger mean? Explain.
a.Determine the degrees of freedom for the t distribution.
b.Develop a 95% confidence interval for the difference between the two population means.
c.Is there conclusive evidence that one population has a larger mean? Explain.
(Essay)
4.8/5 (27)
The heating bills for a selected sample of houses using various forms of heating are given below. (Values are in dollars.)
 a.At = 0.05, test to see if there is a significant difference among the average heating bills of the homes. Use the p-value approach.
b.Test the above hypotheses using the critical value approach. Let = .05.
a.At = 0.05, test to see if there is a significant difference among the average heating bills of the homes. Use the p-value approach.
b.Test the above hypotheses using the critical value approach. Let = .05.
(Essay)
4.8/5 (38)
The test scores for selected samples of statistics students who took the course from three different instructors are shown below.
 At = 0.05, test to see if there is a significant difference among the averages of the three groups. Show the complete ANOVA table.
(Essay)
4.9/5 (34)
Exhibit 10-13
Part of an ANOVA table is shown below.
 -Refer to Exhibit 10-13. The test statistic is
(Multiple Choice)
4.9/5 (42)
Exhibit 10-9
Two major automobile manufacturers have produced compact cars with the same size engines. We are interested in determining whether or not there is a significant difference in the MPG (miles per gallon) of the two brands of automobiles. A random sample of eight cars from each manufacturer is selected, and eight drivers are selected to drive each automobile for a specified distance. The following data show the results of the test.
 -Refer to Exhibit 10-9. At 90% confidence the null hypothesis
(Multiple Choice)
5.0/5 (42)
In an analysis of variance, one estimate of 2 is based upon the differences between the treatment means and the
(Multiple Choice)
4.8/5 (34)
Carolina, Inc. has three stores located in three different areas. Random samples of the sales of the three stores (in $1,000) are shown below. Please note that the sample sizes are not equal.
 a.Compute the overall mean.
b.At 95% confidence, test to see if there is a significant difference in the average sales of the three stores. Use both the critical value and p-value approaches. Show your complete work and the ANOVA table.
a.Compute the overall mean.
b.At 95% confidence, test to see if there is a significant difference in the average sales of the three stores. Use both the critical value and p-value approaches. Show your complete work and the ANOVA table.
(Essay)
4.8/5 (31)
Exhibit 10-8
In order to determine whether or not there is a significant difference between the hourly wages of two companies, the following data have been accumulated.  -Refer to Exhibit 10-8. The p-value is
(Multiple Choice)
4.9/5 (24)
Exhibit 10-14
Part of an ANOVA table is shown below.
 -Refer to Exhibit 10-14. The mean square between treatments (MSTR) is
(Multiple Choice)
4.8/5 (33)
For four populations, the population variances are assumed to be equal. Random samples from each population provide the following data.  Using a .05 level of significance, test to see if the means for all four populations are the same.
(Essay)
4.7/5 (31)
A term that means the same as the term "variable" in an ANOVA procedure is
(Multiple Choice)
4.8/5 (38)
Zip, Inc. manufactures Zip drives on two different manufacturing processes. Because the management of this company is interested in determining if process 1 takes less manufacturing time, they selected independent samples from each process. The results of the samples are shown below.
 a.State the null and alternative hypotheses.
b.Determine the degrees of freedom for the t test.
c.Compute the test statistic
d.At 95% confidence, test to determine if there is sufficient evidence to indicate that process 1 takes a significantly shorter time to manufacture the Zip drives.
a.State the null and alternative hypotheses.
b.Determine the degrees of freedom for the t test.
c.Compute the test statistic
d.At 95% confidence, test to determine if there is sufficient evidence to indicate that process 1 takes a significantly shorter time to manufacture the Zip drives.
(Essay)
4.9/5 (34)
Which of the following is not a required assumption for the analysis of variance?
(Multiple Choice)
4.7/5 (37)
To compute an interval estimate for the difference between the means of two populations, the t distribution
(Multiple Choice)
4.9/5 (37)
Which of the following does not need to be known in order to compute the p-value?
(Multiple Choice)
4.8/5 (28)
Five drivers were selected to test drive 2 makes of automobiles. The following table shows the number of miles per gallon for each driver driving each car.
 Consider the makes of automobiles as treatments and the drivers as blocks, test to see if there is any difference in the miles/gallon of the two makes of automobiles. Let = .05.
(Essay)
4.7/5 (35)
The following sample information is given concerning the ACT scores of high school seniors form two local schools.
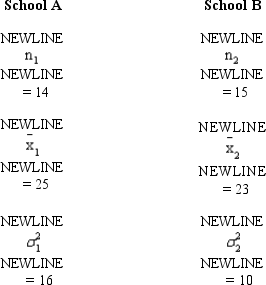 Develop a 95% confidence interval estimate for the difference between the two populations.
(Short Answer)
4.8/5 (38)
Filters
- Essay(0)
- Multiple Choice(0)
- Short Answer(0)
- True False(0)
- Matching(0)