Exam 2: Charts and Graphs
Exam 1: Introduction to Statistics79 Questions
Exam 2: Charts and Graphs75 Questions
Exam 3: Descriptive Statistics63 Questions
Exam 4: Probability72 Questions
Exam 5: Discrete Distributions80 Questions
Exam 6: Continuous Distributions78 Questions
Exam 7: Sampling and Sampling Distributions76 Questions
Exam 8: Statistical Inference: Estimation for Single Populations80 Questions
Exam 9: Statistical Inference: Hypothesis Testing for Single Populations79 Questions
Exam 10: Statistical Inferences About Two Populations70 Questions
Exam 11: Analysis of Variance and Design of Experiments80 Questions
Exam 12: Simple Regression Analysis and Correlation84 Questions
Exam 13: Multiple Regression Analysis80 Questions
Exam 14: Building Multiple Regression Models80 Questions
Exam 15: Time-Series Forecasting and Index Numbers77 Questions
Exam 16: Analysis of Categorical Data76 Questions
Exam 17: Nonparametric Statistics81 Questions
Exam 18: Statistical Quality Control68 Questions
Exam 19: Decision Analysis78 Questions
Select questions type
The following graphic of residential housing data (selling price and size in square feet)indicates ___. 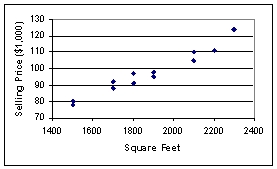
(Multiple Choice)
4.8/5  (42)
(42)
The staff of Mr.Wayne Wertz,VP of Operations at Portland Peoples Bank,prepared a cumulative frequency ogive of waiting time for walk-in customers. 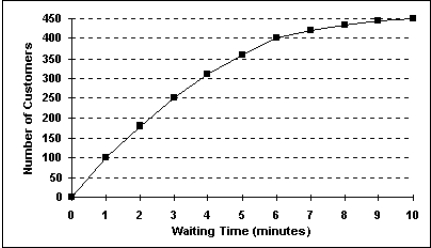 The percentage of walk-in customers waiting more than 6 minutes was ___.
(Multiple Choice)
4.8/5 (35)
The staff of Mr.Wayne Wertz,VP of Operations at Portland Peoples Bank,prepared a cumulative frequency ogive of waiting time for walk-in customers.  The percentage of walk-in customers waiting between 1 and 6 minutes was ___.
(Multiple Choice)
4.8/5 (41)
The staff of Mr.Wayne Wertz,VP of Operations at Portland Peoples Bank,prepared a frequency histogram of waiting time for walk-in customers. 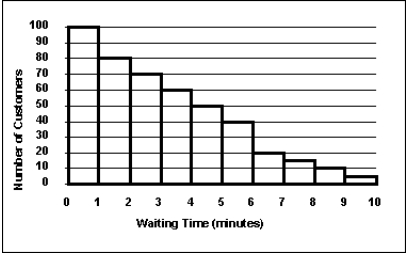 Approximately ___ walk-in customers waited at least 7 minutes.
(Multiple Choice)
4.8/5 (35)
The following class intervals for a frequency distribution were developed to provide information regarding the starting salaries for students graduating from a particular school: 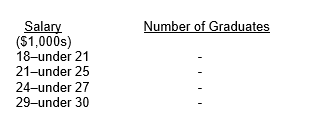 Before data was collected,someone questioned the validity of this arrangement.Which of the following represents a problem with this set of intervals?
(Multiple Choice)
4.8/5 (26)
The number of phone calls arriving at a switchboard each hour has been recorded,and the following frequency distribution has been developed:  What is the relative frequency of the second class?
(Multiple Choice)
4.9/5 (32)
Each day,the office staff at Oasis Quick Shop prepares a frequency distribution and an ogive of sales transactions by dollar value of the transactions.Saturday's cumulative frequency ogive follows:  The percentage of sales transactions on Saturday that were under $100 each was ___.
(Multiple Choice)
4.8/5 (26)
Consider the following frequency distribution: 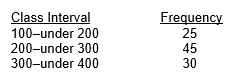 What is the cumulative frequency of the second class interval?
(Multiple Choice)
4.8/5 (38)
According to the following graphic,"Bent Pins" account for ___% of PCB Failures. 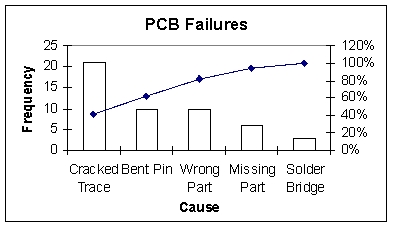
(Multiple Choice)
4.9/5 (29)
Consider the following stem and leaf plot: 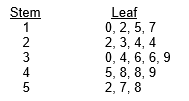 Suppose that a frequency distribution was developed from this,and there were 5 classes (10-under 20,20-under 30,etc. ).What was the highest number in the data set?
(Multiple Choice)
4.8/5 (37)
One rule that must always be followed in constructing frequency distributions is that the adjacent classes must overlap.
(True/False)
4.7/5 (32)
An instructor has decided to graphically represent the grades on a test.The instructor uses a plus/minus grading system (i.e. ,she gives grades of A-,B+,etc. ).Which of the following would provide the most information for the students?
(Multiple Choice)
4.8/5 (38)
Each day,the office staff at Oasis Quick Shop prepares a frequency distribution and an ogive of sales transactions by dollar value of the transactions.Saturday's cumulative frequency ogive follows: 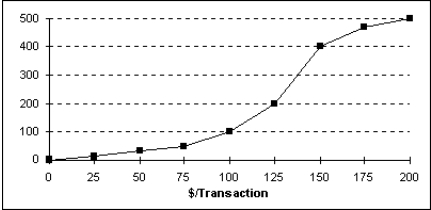 The percentage of sales transactions on Saturday that were between $100 and $150 was ___.
(Multiple Choice)
4.8/5 (33)
The number of phone calls arriving at a switchboard each hour has been recorded,and the following frequency distribution has been developed: 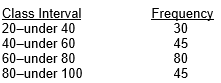 What is the cumulative frequency of the third class?
(Multiple Choice)
4.9/5 (35)
Consider the following frequency distribution: 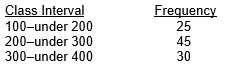 What is the midpoint of the first class?
(Multiple Choice)
4.9/5 (39)
The staffs of the accounting and the quality control departments rated their respective supervisor's leadership style as either (1)authoritarian or (2)participatory.Sixty-eight percent of the accounting staff rated their supervisor "authoritarian," and thirty-two percent rated him "participatory." Forty percent of the quality control staff rated their supervisor "authoritarian," and sixty percent rated her "participatory." The best graphic depiction of these data would be two ___.
(Multiple Choice)
4.8/5 (35)
A scatter plot is a two-dimensional graph plot of data containing pairs of observations on two numerical variables.
(True/False)
4.9/5 (33)
According to the following graphic the most common cause of PCB Failures is a ___. 
(Multiple Choice)
4.9/5 (38)
Filters
- Essay(0)
- Multiple Choice(0)
- Short Answer(0)
- True False(0)
- Matching(0)