Exam 2: Charts and Graphs
Exam 1: Introduction to Statistics79 Questions
Exam 2: Charts and Graphs75 Questions
Exam 3: Descriptive Statistics63 Questions
Exam 4: Probability72 Questions
Exam 5: Discrete Distributions80 Questions
Exam 6: Continuous Distributions78 Questions
Exam 7: Sampling and Sampling Distributions76 Questions
Exam 8: Statistical Inference: Estimation for Single Populations80 Questions
Exam 9: Statistical Inference: Hypothesis Testing for Single Populations79 Questions
Exam 10: Statistical Inferences About Two Populations70 Questions
Exam 11: Analysis of Variance and Design of Experiments80 Questions
Exam 12: Simple Regression Analysis and Correlation84 Questions
Exam 13: Multiple Regression Analysis80 Questions
Exam 14: Building Multiple Regression Models80 Questions
Exam 15: Time-Series Forecasting and Index Numbers77 Questions
Exam 16: Analysis of Categorical Data76 Questions
Exam 17: Nonparametric Statistics81 Questions
Exam 18: Statistical Quality Control68 Questions
Exam 19: Decision Analysis78 Questions
Select questions type
A graphical representation of a frequency distribution is called a pie chart.
(True/False)
4.8/5  (36)
(36)
Consider the relative frequency distribution given below: 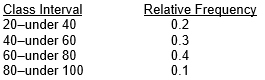 There were 60 numbers in the data set.How many numbers were in the interval 20-under 40?
(Multiple Choice)
4.9/5 (44)
Pinky Bauer,Chief Financial Officer of Harrison Haulers,Inc. ,suspects irregularities in the payroll system,and orders an inspection of "each and every payroll voucher issued since January 1,2000." Each payroll voucher was inspected and the following frequency distribution was compiled. 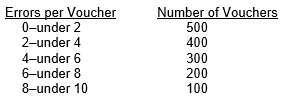 The relative frequency of the first class interval is ___.
(Multiple Choice)
4.8/5 (49)
Consider the following stem and leaf plot: 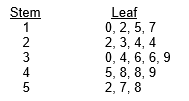 Suppose that a frequency distribution was developed from this,and there were 5 classes (10-under 20,20-under 30,etc. ).What would the frequency be for class 30-under 40?
(Multiple Choice)
4.8/5 (26)
Consider the following frequency distribution:
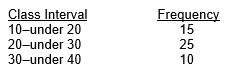 What is the relative frequency of the first class?
(Multiple Choice)
5.0/5 (36)
The cumulative frequency for a class is 27.The cumulative frequency for the next (non-empty)class will be ___.
(Multiple Choice)
4.8/5 (47)
The 1999 and 2000 market share data of the three competitors (A,B,and C)in an oligopolistic industry are presented in the following pie charts.Total sales for this industry were $1.5 billion in 1999 and $1.8 billion in 2000.Company C's sales in 2000 were ___.
(Multiple Choice)
4.7/5 (30)
For any given data set,a frequency distribution with a larger number of classes will always be better than the one with a smaller number of classes.
(True/False)
4.7/5 (31)
Consider the following stem and leaf plot:
Suppose that a frequency distribution was developed from this,and there were 5 classes (10-under 20,20-under 30,etc. ).What was the lowest number in the data set?
(Multiple Choice)
4.7/5 (34)
The difference between the highest number and the lowest number in a set of data is called the differential frequency.
(True/False)
4.7/5 (41)
A person has decided to construct a frequency distribution for a set of data containing 60 numbers.The lowest number is 23 and the highest number is 68.If 7 classes are used,the class width should be approximately ___.
(Multiple Choice)
4.8/5 (33)
The 1999 and 2000 market share data of the three competitors (A,B,and C)in an oligopolistic industry are presented in the following pie charts.Total sales for this industry were $1.5 billion in 1999 and $1.8 billion in 2000. 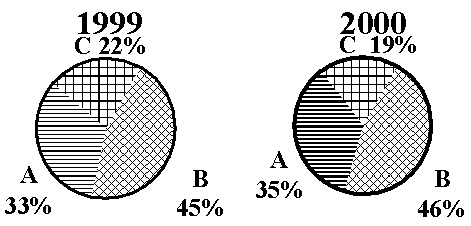 Company B's sales in 1999 were ___.
(Multiple Choice)
4.9/5 (41)
Describe and construct different types of quantitative data graphs,including histograms,frequency polygons,ogives,and stem and leaf plots.Explain when these graphs should be used.
(Essay)
4.7/5 (30)
Abel Alonzo,Director of Human Resources,is exploring employee absenteeism at the Harrison Haulers Plant during the last operating year.A review of all personnel records indicated that absences ranged from zero to twenty-nine days per employee.The following class intervals were proposed for a frequency distribution of absences: 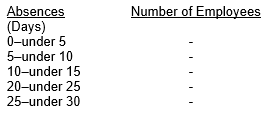 Which of the following represents a problem with this set of intervals?
(Multiple Choice)
4.9/5 (34)
Filters
- Essay(0)
- Multiple Choice(0)
- Short Answer(0)
- True False(0)
- Matching(0)