Exam 9: Comparative Advantage and the Gains From International Trade
Exam 1: Economics: Foundations and Models444 Questions
Exam 2: Trade-Offs, Comparative Advantage, and the Market System498 Questions
Exam 3: Where Prices Come From: the Interaction of Demand and Supply475 Questions
Exam 4: Economic Efficiency, Government Price Setting, and Taxes419 Questions
Exam 5: Externalities, Environmental Policy, and Public Goods266 Questions
Exam 6: Elasticity: the Responsiveness of Demand and Supply295 Questions
Exam 7: The Economics of Health Care334 Questions
Exam 8: Firms, the Stock Market, and Corporate Governance278 Questions
Exam 9: Comparative Advantage and the Gains From International Trade379 Questions
Exam 10: Consumer Choice and Behavioral Economics302 Questions
Exam 11: Technology, Production, and Costs330 Questions
Exam 12: Firms in Perfectly Competitive Markets298 Questions
Exam 13: Monopolistic Competition: the Competitive Model in a More Realistic Setting276 Questions
Exam 14: Oligopoly: Firms in Less Competitive Markets262 Questions
Exam 15: Monopoly and Antitrust Policy271 Questions
Exam 16: Pricing Strategy263 Questions
Exam 17: The Markets for Labor and Other Factors of Production286 Questions
Exam 18: Public Choice, Taxes, and the Distribution of Income258 Questions
Exam 19: GDP: Measuring Total Production and Income266 Questions
Exam 20: Unemployment and Inflation292 Questions
Exam 21: Economic Growth, the Financial System, and Business Cycles257 Questions
Exam 22: Long-Run Economic Growth: Sources and Policies268 Questions
Exam 23: Aggregate Expenditure and Output in the Short Run306 Questions
Exam 24: Aggregate Demand and Aggregate Supply Analysis284 Questions
Exam 25: Money, Banks, and the Federal Reserve System280 Questions
Exam 26: Monetary Policy277 Questions
Exam 27: Fiscal Policy303 Questions
Exam 28: Inflation, Unemployment, and Federal Reserve Policy257 Questions
Exam 29: Macroeconomics in an Open Economy278 Questions
Exam 30: The International Financial System262 Questions
Select questions type
All of the following are sources of comparative advantage except
(Multiple Choice)
4.8/5  (33)
(33)
Figure 9-7 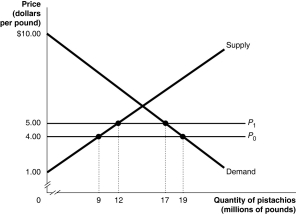 -Refer to Figure 9-7. Fenwick currently both produces and imports pistachios. The government of Fenwick decides to restrict international trade in pistachios by imposing a quota that allows imports of only 5 million pounds each year. Figure 9-7 shows the estimated demand and supply curves for pistachios in Fenwick and the results of imposing the quota. Answer questions a-j using the figure.
a. If there is no quota what is the domestic price of pistachios and what is the quantity of pistachios demanded by consumers?
b. If there is no quota how many pounds of pistachios would domestic producers supply and what quantity would be imported?
c. If there is no quota what is the dollar value of consumer surplus?
d. If there is no quota what is the dollar value of producer surplus received by producers in Fenwick?
e. If there is no quota what is the revenue received by foreign producers who supply pistachios to Fenwick?
f. With a quota in place what is the price that consumers of Fenwick must now pay and what is the quantity demanded?
g. With a quota in place what is the dollar value of consumer surplus? Are consumers better off?
h. With a quota in place what is the dollar value of producer surplus received by producers in Fenwick? Are domestic producers better off?
i. Calculate the revenue to foreign producers who are granted permission to sell in Fenwick after the imposition of the quota.
j. Calculate the deadweight loss as a result of the quota.
-Refer to Figure 9-7. Fenwick currently both produces and imports pistachios. The government of Fenwick decides to restrict international trade in pistachios by imposing a quota that allows imports of only 5 million pounds each year. Figure 9-7 shows the estimated demand and supply curves for pistachios in Fenwick and the results of imposing the quota. Answer questions a-j using the figure.
a. If there is no quota what is the domestic price of pistachios and what is the quantity of pistachios demanded by consumers?
b. If there is no quota how many pounds of pistachios would domestic producers supply and what quantity would be imported?
c. If there is no quota what is the dollar value of consumer surplus?
d. If there is no quota what is the dollar value of producer surplus received by producers in Fenwick?
e. If there is no quota what is the revenue received by foreign producers who supply pistachios to Fenwick?
f. With a quota in place what is the price that consumers of Fenwick must now pay and what is the quantity demanded?
g. With a quota in place what is the dollar value of consumer surplus? Are consumers better off?
h. With a quota in place what is the dollar value of producer surplus received by producers in Fenwick? Are domestic producers better off?
i. Calculate the revenue to foreign producers who are granted permission to sell in Fenwick after the imposition of the quota.
j. Calculate the deadweight loss as a result of the quota.
(Essay)
4.8/5 (38)
Once an industry becomes established in a certain area firms that locate in that area gain advantages over firms located elsewhere, leading to lower costs of production. Economists refer to the lower costs that result from increases in the size of an industry in a certain area as
(Multiple Choice)
4.9/5 (33)
Table 9-12
Production and
Consumption Production
Without Trade With Trade
 Estonia and Morocco can produce both swords and belts. Table 9-12 shows the production and consumption quantities without trade, and the production numbers with trade.
-Refer to Table 9-12. If the actual terms of trade are 1 belt for 1.5 swords and 70 belts are traded, how many swords will Estonia consume?
Estonia and Morocco can produce both swords and belts. Table 9-12 shows the production and consumption quantities without trade, and the production numbers with trade.
-Refer to Table 9-12. If the actual terms of trade are 1 belt for 1.5 swords and 70 belts are traded, how many swords will Estonia consume?
(Multiple Choice)
4.9/5 (31)
Table 9-6
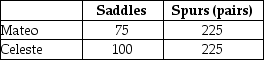 Mateo and Celeste produce custom saddles and spurs. Table 9-6 lists the number of saddles and pairs of spurs Mateo and Celeste can each produce in one month.
-Refer to Table 9-6. Select the statement that accurately interprets the data in the table.
Mateo and Celeste produce custom saddles and spurs. Table 9-6 lists the number of saddles and pairs of spurs Mateo and Celeste can each produce in one month.
-Refer to Table 9-6. Select the statement that accurately interprets the data in the table.
(Multiple Choice)
4.8/5 (33)
Figure 9-6 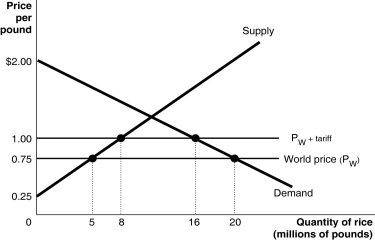 -Refer to Figure 9-6. Suppose the U.S. government imposes a $0.25 per pound tariff on rice imports. Figure 9-6 shows the demand and supply curves for rice and the impact of this tariff. Use the figure to answer questions a-i.
a. Following the imposition of the tariff, what is the price that domestic consumers must now pay and what is the quantity purchased?
b. Calculate the value of consumer surplus with the tariff in place.
c. What is the quantity supplied by domestic rice growers with the tariff in place?
d. Calculate the value of producer surplus received by U.S. rice growers with the tariff in place.
e. What is the quantity of rice imported with the tariff in place?
f. What is the amount of tariff revenue collected by the government?
g. The tariff has reduced consumer surplus. Calculate the loss in consumer surplus due to the tariff.
h. What portion of the consumer surplus loss is redistributed to domestic producers? To the government?
i. Calculate the deadweight loss due to the tariff.
-Refer to Figure 9-6. Suppose the U.S. government imposes a $0.25 per pound tariff on rice imports. Figure 9-6 shows the demand and supply curves for rice and the impact of this tariff. Use the figure to answer questions a-i.
a. Following the imposition of the tariff, what is the price that domestic consumers must now pay and what is the quantity purchased?
b. Calculate the value of consumer surplus with the tariff in place.
c. What is the quantity supplied by domestic rice growers with the tariff in place?
d. Calculate the value of producer surplus received by U.S. rice growers with the tariff in place.
e. What is the quantity of rice imported with the tariff in place?
f. What is the amount of tariff revenue collected by the government?
g. The tariff has reduced consumer surplus. Calculate the loss in consumer surplus due to the tariff.
h. What portion of the consumer surplus loss is redistributed to domestic producers? To the government?
i. Calculate the deadweight loss due to the tariff.
(Essay)
4.9/5 (35)
The United States would gain from the elimination of tariffs and quotas even if other countries do not reduce their tariffs and quotas.
(True/False)
4.9/5 (30)
The first example of comparative advantage appeared in a book that was published in 1817. This example showed that mutually beneficial trade between two countries (England and Portugal) was possible. The example assumed that two goods (wine and cloth) could be produced by both countries. Which of the following describes the conclusion of this example?
(Multiple Choice)
4.8/5 (42)
Figure 9-3 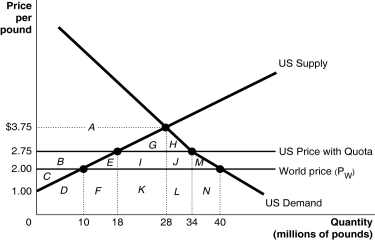 Since 1953 the United States has imposed a quota to limit the imports of peanuts. Figure 9-3 illustrates the impact of the quota.
-Refer to Figure 9-3. What is the area of domestic producer surplus after the imposition of a quota?
Since 1953 the United States has imposed a quota to limit the imports of peanuts. Figure 9-3 illustrates the impact of the quota.
-Refer to Figure 9-3. What is the area of domestic producer surplus after the imposition of a quota?
(Multiple Choice)
4.8/5 (36)
The first discussion of comparative advantage appears in a book written by
(Multiple Choice)
5.0/5 (30)
Table 9-2
 Sarita and Gabriel own S&G Bakery. Table 9-2 lists the number of pies and cakes Sarita and Gabriel can each bake in one day.
-Refer to Table 9-2. Select the statement that accurately interprets the data in the table.
Sarita and Gabriel own S&G Bakery. Table 9-2 lists the number of pies and cakes Sarita and Gabriel can each bake in one day.
-Refer to Table 9-2. Select the statement that accurately interprets the data in the table.
(Multiple Choice)
4.8/5 (25)
Table 9-3
 Bryce and Tina are artisans who produce homemade candles and soap. Table 9-3 lists the number of candles and bars of soap Bryce and Tina can each produce in one month.
-Refer to Table 9-3. Select the statement that accurately interprets the data in the table.
Bryce and Tina are artisans who produce homemade candles and soap. Table 9-3 lists the number of candles and bars of soap Bryce and Tina can each produce in one month.
-Refer to Table 9-3. Select the statement that accurately interprets the data in the table.
(Multiple Choice)
4.8/5 (35)
Domestic producers require time to gain experience and lower their unit costs; this will allow these producers to compete successfully in international markets. This statement describes the ________ argument for protectionism.
(Multiple Choice)
4.8/5 (32)
The process of countries becoming more open to foreign trade and investment is known as
(Multiple Choice)
4.7/5 (42)
If Norwegian workers are more productive than Albanian workers, then trade between Norway and Albania
(Multiple Choice)
4.9/5 (38)
Protectionism is the use of ________ to protect domestic firms from foreign competition.
(Multiple Choice)
4.8/5 (44)
Table 9-12
Production and
Consumption Production
Without Trade With Trade
Estonia and Morocco can produce both swords and belts. Table 9-12 shows the production and consumption quantities without trade, and the production numbers with trade.
-Refer to Table 9-12. Which country has a comparative advantage in producing belts?
(Multiple Choice)
4.9/5 (39)
Figure 9-1 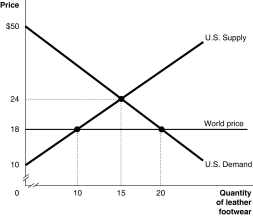 Figure 9-1 shows the U.S. demand and supply for leather footwear.
-Refer to Figure 9-1. Suppose the government allows imports of leather footwear into the United States. What will be the quantity of imports?
Figure 9-1 shows the U.S. demand and supply for leather footwear.
-Refer to Figure 9-1. Suppose the government allows imports of leather footwear into the United States. What will be the quantity of imports?
(Multiple Choice)
4.8/5 (37)
Figure 9-2 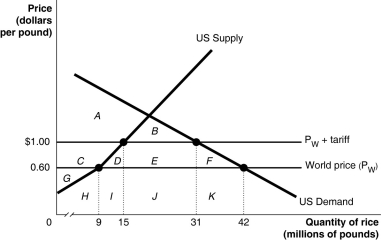 Suppose the U.S. government imposes a $0.40 per pound tariff on rice imports. Figure 9-2 shows the impact of this tariff.
-Refer to Figure 9-2. With the tariff in place, the United States consumes
Suppose the U.S. government imposes a $0.40 per pound tariff on rice imports. Figure 9-2 shows the impact of this tariff.
-Refer to Figure 9-2. With the tariff in place, the United States consumes
(Multiple Choice)
4.8/5 (43)
________ refers to reductions in a firm's costs that result from an increase in the size of an industry.
(Multiple Choice)
4.8/5 (38)
Filters
- Essay(0)
- Multiple Choice(0)
- Short Answer(0)
- True False(0)
- Matching(0)