Exam 5: Externalities, Environmental Policy, and Public Goods
Exam 1: Economics: Foundations and Models444 Questions
Exam 2: Trade-Offs, Comparative Advantage, and the Market System498 Questions
Exam 3: Where Prices Come From: the Interaction of Demand and Supply475 Questions
Exam 4: Economic Efficiency, Government Price Setting, and Taxes419 Questions
Exam 5: Externalities, Environmental Policy, and Public Goods266 Questions
Exam 6: Elasticity: the Responsiveness of Demand and Supply295 Questions
Exam 7: The Economics of Health Care334 Questions
Exam 8: Firms, the Stock Market, and Corporate Governance278 Questions
Exam 9: Comparative Advantage and the Gains From International Trade379 Questions
Exam 10: Consumer Choice and Behavioral Economics302 Questions
Exam 11: Technology, Production, and Costs330 Questions
Exam 12: Firms in Perfectly Competitive Markets298 Questions
Exam 13: Monopolistic Competition: the Competitive Model in a More Realistic Setting276 Questions
Exam 14: Oligopoly: Firms in Less Competitive Markets262 Questions
Exam 15: Monopoly and Antitrust Policy271 Questions
Exam 16: Pricing Strategy263 Questions
Exam 17: The Markets for Labor and Other Factors of Production286 Questions
Exam 18: Public Choice, Taxes, and the Distribution of Income258 Questions
Exam 19: GDP: Measuring Total Production and Income266 Questions
Exam 20: Unemployment and Inflation292 Questions
Exam 21: Economic Growth, the Financial System, and Business Cycles257 Questions
Exam 22: Long-Run Economic Growth: Sources and Policies268 Questions
Exam 23: Aggregate Expenditure and Output in the Short Run306 Questions
Exam 24: Aggregate Demand and Aggregate Supply Analysis284 Questions
Exam 25: Money, Banks, and the Federal Reserve System280 Questions
Exam 26: Monetary Policy277 Questions
Exam 27: Fiscal Policy303 Questions
Exam 28: Inflation, Unemployment, and Federal Reserve Policy257 Questions
Exam 29: Macroeconomics in an Open Economy278 Questions
Exam 30: The International Financial System262 Questions
Select questions type
Figure 5-10 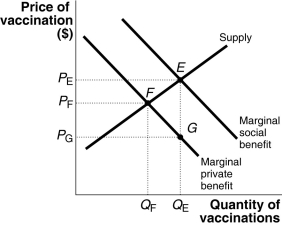 Chicken pox vaccinations for toddlers benefit society by protecting young children and by preventing an epidemic of the disease. Thus, the social benefits of chicken pox vaccinations exceed the private benefit for any quantity of vaccinations as illustrated in Figure 5-10.
-Refer to Figure 5-10. One way to obtain the economically efficient amount of chicken pox vaccinations is for governments to subsidize these vaccinations. What is the size of the per-vaccination Pigovian subsidy that the government must provide to internalize the external benefits?
Chicken pox vaccinations for toddlers benefit society by protecting young children and by preventing an epidemic of the disease. Thus, the social benefits of chicken pox vaccinations exceed the private benefit for any quantity of vaccinations as illustrated in Figure 5-10.
-Refer to Figure 5-10. One way to obtain the economically efficient amount of chicken pox vaccinations is for governments to subsidize these vaccinations. What is the size of the per-vaccination Pigovian subsidy that the government must provide to internalize the external benefits?
(Multiple Choice)
4.7/5  (36)
(36)
Figure 5-5 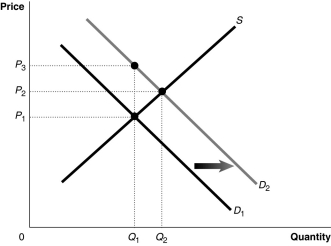 Figure 5-5 shows a market with an externality. The current market equilibrium output of Q1 is not the economically efficient output. The economically efficient output is Q2.
-Refer to Figure 5-5. Suppose the current market equilibrium output of Q1 is not the economically efficient output because of an externality. The economically efficient output is Q2. In that case, the diagram shows
Figure 5-5 shows a market with an externality. The current market equilibrium output of Q1 is not the economically efficient output. The economically efficient output is Q2.
-Refer to Figure 5-5. Suppose the current market equilibrium output of Q1 is not the economically efficient output because of an externality. The economically efficient output is Q2. In that case, the diagram shows
(Multiple Choice)
4.9/5 (43)
Article Summary
According to a study by the Center for Neighborhood Technology, homes located within one-half mile of frequently-used public transportation held their value much better during the recent housing market downturn than did those without easy access to public transportation, and the greater home values reflect greater demand for neighborhoods in close proximity to public transportation. In addition to higher home values, the study found that close proximity to public transportation offers lower transportation costs, a wider variety of travel options, and access to more employment opportunities.
Source: Meg Handley, "Study: Proximity to Public Transit Boosts Home Values," U.S. News & World Report, March 22, 2013.
-Refer to the Article Summary. People who do not use public transportation can still benefit from it, as is shown by the higher home values. As a result, the marginal social benefit from public transportation is ________ the marginal private benefit to those who use public transportation.
(Multiple Choice)
4.8/5 (33)
Which of the following best illustrates the free rider problem?
(Multiple Choice)
4.8/5 (33)
Global warming refers to the effect of global pollutants such as carbon dioxide on climates on the earth. Climate-induced changes in temperatures affect, among other things, agriculture. Which of the following is a reason why policymakers are still debating if this problem should be addressed and how it should be addressed?
(Multiple Choice)
4.7/5 (32)
Figure 5-2  Figure 5-2 shows a market with a negative externality.
-Refer to Figure 5-2. The size of marginal external costs can be determined by
Figure 5-2 shows a market with a negative externality.
-Refer to Figure 5-2. The size of marginal external costs can be determined by
(Multiple Choice)
4.7/5 (43)
How does a public good differ from a quasi-public good? In your answer give an example of each type of good.
(Essay)
4.9/5 (38)
If the social benefit of consuming a good or a service exceeds the private benefit
(Multiple Choice)
4.8/5 (28)
Assume that production from an electric utility caused acid rain and that the government imposed a tax on the utility equal to the cost of the acid rain. This is an example of
(Multiple Choice)
4.8/5 (40)
Figure 5-4 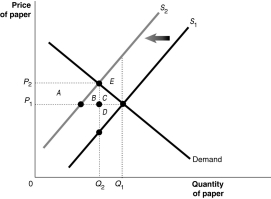 Suppose there are several paper mills producing paper for a market. These mills, located upstream from a fishing village, discharge a large amount of wastewater into the river. The waste material affects the number of fish in the river, and the use of the river for recreation and as a public water supply source. Figure 5-4 shows the paper market. Use this Figure to answer the following question(s).
-Refer to Figure 5-4. What is the economically efficient output level?
Suppose there are several paper mills producing paper for a market. These mills, located upstream from a fishing village, discharge a large amount of wastewater into the river. The waste material affects the number of fish in the river, and the use of the river for recreation and as a public water supply source. Figure 5-4 shows the paper market. Use this Figure to answer the following question(s).
-Refer to Figure 5-4. What is the economically efficient output level?
(Multiple Choice)
4.8/5 (39)
Figure 5-1 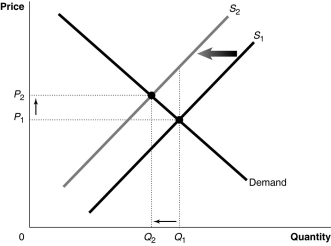 Figure 5-1 shows a market with an externality. The current market equilibrium output of Q1 is not the economically efficient output. The economically efficient output is Q2.
-Refer to Figure 5-1. Suppose the current market equilibrium output of Q1 is not the economically efficient output because of an externality. The economically efficient output is Q2. In that case, the diagram shows
Figure 5-1 shows a market with an externality. The current market equilibrium output of Q1 is not the economically efficient output. The economically efficient output is Q2.
-Refer to Figure 5-1. Suppose the current market equilibrium output of Q1 is not the economically efficient output because of an externality. The economically efficient output is Q2. In that case, the diagram shows
(Multiple Choice)
4.7/5 (38)
Figure 5-13 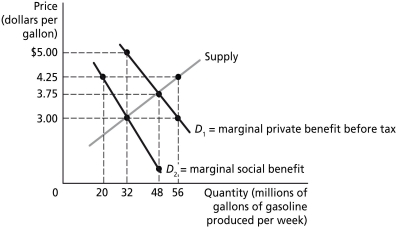 Figure 5-13 illustrates the market for gasoline before and after the government imposes a tax to bring about the efficient level of gasoline production.
-Refer to Figure 5-13. The gasoline tax raises the price paid by consumers by ________ per gallon.
Figure 5-13 illustrates the market for gasoline before and after the government imposes a tax to bring about the efficient level of gasoline production.
-Refer to Figure 5-13. The gasoline tax raises the price paid by consumers by ________ per gallon.
(Multiple Choice)
4.8/5 (25)
If the United States and other developed nations pay the cost of reducing public emissions, developing nations such as China could benefit from the reduction while not contributing to it. In this sense, one can think of reducing carbon emissions as being like a
(Multiple Choice)
4.8/5 (41)
When a negative externality exists, the private market produces
(Multiple Choice)
4.8/5 (34)
Figure 5-10 Chicken pox vaccinations for toddlers benefit society by protecting young children and by preventing an epidemic of the disease. Thus, the social benefits of chicken pox vaccinations exceed the private benefit for any quantity of vaccinations as illustrated in Figure 5-10.
-A major problem with using tradable emissions allowance system to control pollution is
(Multiple Choice)
4.9/5 (32)
Some policymakers have argue that products like cigarettes, alcohol, and sweetened soda generate negative externalities in consumption. All else equal, if the government decided to impose a tax on soda, the equilibrium quantity of soda would ________ and the equilibrium price of soda would ________.
(Multiple Choice)
4.8/5 (37)
Filters
- Essay(0)
- Multiple Choice(0)
- Short Answer(0)
- True False(0)
- Matching(0)