Exam 6: Statistical Quality Control
Exam 1: Introduction to Operations Management132 Questions
Exam 2: Operations Strategy and Competitiveness135 Questions
Exam 3: Product Design and Process Selection128 Questions
Exam 4: E-Commerce and Supply Chain Management139 Questions
Exam 5: Total Quality Management141 Questions
Exam 6: Statistical Quality Control136 Questions
Exam 7: Just-In-Time and Lean Systems137 Questions
Exam 8: Forecasting138 Questions
Exam 9: Capacity Planning and Facility Location139 Questions
Exam 10: Facility Layout139 Questions
Exam 11: Work System Design132 Questions
Exam 12: Independent Demand Inventory Management137 Questions
Exam 13: Aggregate Planning104 Questions
Exam 14: Resource Planning133 Questions
Exam 15: Scheduling127 Questions
Exam 16: Project Management134 Questions
Exam 16: Spreadsheet Modeling: an Introduction137 Questions
Exam 17: Spreadsheet Modeling: an Introduction133 Questions
Exam 18: Waiting Line Models132 Questions
Exam 19: Master Scheduling and Rough-Cut Capacity Planning69 Questions
Select questions type
What measures the difference between the largest and smallest observations in a set of data?
(Multiple Choice)
5.0/5  (41)
(41)
Which of the following would imply that data observations are closely clustered around the mean?
(Multiple Choice)
4.8/5 (44)
What are the two aspects to implementing the six-sigma concept?
(Multiple Choice)
4.9/5 (43)
Consider a p-chart measuring the percentage of defective light bulbs. If the LCL is .04 and a sample has 1% defects, what is the implication?
(Multiple Choice)
4.9/5 (33)
Six sigma programs strive to set control limits at ________________________.
(Short Answer)
5.0/5 (37)
Product specifications are preset, whereas control limits are computed after observing data.
(True/False)
4.8/5 (40)
A process can be considered in a state of control even if one observation is 1.75 standard deviations above the mean.
(True/False)
4.9/5 (41)
Mrs. Crabapple has a class with three students, and she has had four quizzes so far this semester. She has created control charts to determine if the variation in students' scores from quiz to quiz is exhibiting only natural variation. Each of the quiz scores is shown below. The upper and lower control limits for the x chart are 109.6 and 34.9, respectively. The upper and lower control limits for the R chart are 93.95 and 0, respectively.
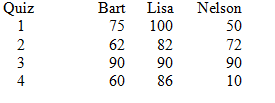 Is the process in a state of control?
(Essay)
4.9/5 (31)
Suppose that you want to monitor the average ounces of a process that fills beer cans. Which control chart would be appropriate?
(Multiple Choice)
4.8/5 (42)
A skewed distribution implies that assignable causes of variation may be present.
(True/False)
4.8/5 (39)
A process capability index (Cp)value of 1 means that what percent of products produced will fall within the specification limits?
(Multiple Choice)
4.8/5 (36)
Upper and lower control limits are usually set at how many standard deviations from the mean?
(Multiple Choice)
4.9/5 (39)
Filters
- Essay(0)
- Multiple Choice(0)
- Short Answer(0)
- True False(0)
- Matching(0)