Exam 10: Graphs, Good and Bad
Exam 1: Where Do Data Come From30 Questions
Exam 2: Samples, Good and Bad30 Questions
Exam 3: What Do Samples Tell Us55 Questions
Exam 4: Sample Surveys in the Real World36 Questions
Exam 5: Experiments, Good and Bad50 Questions
Exam 6: Experiments in the Real World32 Questions
Exam 7: Data Ethics21 Questions
Exam 8: Measuring33 Questions
Exam 9: Do the Numbers Make Sense25 Questions
Exam 10: Graphs, Good and Bad30 Questions
Exam 11: Displaying Distributions With Graphs22 Questions
Exam 13: Normal Distributions54 Questions
Exam 14: Describing Relationships: Scatterplots and Correlation56 Questions
Exam 15: Describing Relationships: Regression, Prediction, and Causation37 Questions
Exam 16: The Consumer Price Index and Government Statistics31 Questions
Exam 17: Thinking About Chance25 Questions
Exam 18: Probability Models30 Questions
Exam 19: Simulation20 Questions
Exam 20: The House Edge: Expected Values30 Questions
Exam 21: What Is a Confidence Interval43 Questions
Exam 22: What Is a Test of Significance30 Questions
Exam 23: Use and Abuse of Statistical Inference18 Questions
Exam 24: Two-Way Tables and the Chi-Square Test47 Questions
Select questions type
A __________ tells us what values a variable takes and how often it takes those values.
Free
(Multiple Choice)
4.8/5  (25)
(25)
Correct Answer: Verified
A
Is the type of high school a person went to, public or private, a significant factor in predicting that person's future college grade point average (GPA)? A researcher gathers data on the type of high school and college GPA for 569 college seniors. These measurements are values of
Free
(Multiple Choice)
4.9/5 (36)
Correct Answer:Verified
C
In order to be correct, a line graph of the number of suicides per year in the United States must have
Free
(Multiple Choice)
4.9/5 (34)
Correct Answer:Verified
B
A company database contains the following information about each employee: age, date hired, sex (male or female), ethnic group (Asian, black, Hispanic, etc.), job category (clerical, management, technical, etc.), and yearly salary. Which of the following lists of variables are all categorical?
(Multiple Choice)
4.8/5 (42)
You are planning an experiment to determine the effect of the brand of gasoline and the weight of a car on gas mileage measured in miles per gallon. You will use a single test car, adding weights so that its total weight is 3000, 3500, or 4000 pounds. The car will drive on a test track at each weight using each of Exxon, Sunoco, and Texaco gasoline.
In this study, gasoline brand is a(n)
(Multiple Choice)
4.9/5 (30)
Were the extinctions that occurred in the last ice age more frequent among species of animals with large body sizes? A researcher gathers data on the average body mass (in kilograms) of all species known to have existed at that time. These measurements are values of
(Multiple Choice)
4.8/5 (33)
The age, weight, imbiber status (drinker or nondrinker), level of education (high school graduate or not,) and earned income of a simple random sample of 1,463 people is measured. The number of variables measured is:
(Multiple Choice)
4.9/5 (37)
In a young woman's study group, 7 percent of the students are from the town where the young woman's school is located, 80 percent are from in-state (but not from the school's town), and the rest are from outside the state.
The proper graph for showing distribution of students in the study group is a:
(Multiple Choice)
4.7/5 (26)
Here is a table of the undergraduate enrollment at a large state university, broken down by class:
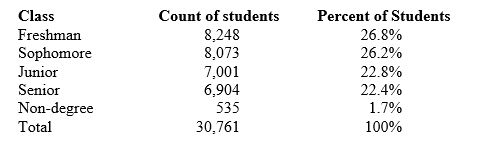 The percentage of students in the five classifications should add to 100%. In fact, they add to only 99.9%. The reason is that
(Multiple Choice)
4.8/5 (33)
A line graph shows that the price of fresh oranges falls early in each year when the orange harvest in Florida is ready, then it rises late in the year when oranges from that year's harvest begin to run out. This is an example of
(Multiple Choice)
4.8/5 (36)
While an analyst considers the time plot of the closing value of the Dow Jones Industrial Average, he notices a trend. This means he sees:
(Multiple Choice)
4.9/5 (32)
Does using a cell phone while driving make an accident more likely? Researchers compared telephone company and police records to find 699 people who had cell phones and were also involved in an auto accident. Using billing records, they compared cell phone use in the period of the accident with cell phone use the same period on a previous day. Result: The risk of an accident was four times higher when using a cell phone.
The researchers also recorded the manufacturer of each subject's cell phone (Apple, Samsung, etc.). This variable is
(Multiple Choice)
4.8/5 (30)
You are planning an experiment to determine the effect of the brand of gasoline and the weight of a car on gas mileage measured in miles per gallon. You will use a single test car, adding weights so that its total weight is 3000, 3500, or 4000 pounds. The car will drive on a test track at each weight using each of Exxon, Sunoco, and Texaco gasoline.
In this study,
(Multiple Choice)
4.7/5 (36)
In a young woman's study group, 7 percent of the students are from the town where the young woman's school is located, 80 percent are from in-state (but not from the school's town), and the rest are from outside the state.
What percent of study group students is from outside the state?
(Multiple Choice)
4.9/5 (42)
When pictures replace the bars in a bar graph, the resulting graph is called a
(Multiple Choice)
4.8/5 (37)
To display the percent of residents at least 65 years old in each of the 50 states in 2011, a good choice of a graph would be a:
(Multiple Choice)
4.8/5 (39)
In order to create a good graph, you must do each of the following EXCEPT
(Multiple Choice)
4.7/5 (33)
Filters
- Essay(0)
- Multiple Choice(0)
- Short Answer(0)
- True False(0)
- Matching(0)