Exam 22: Consumer Preferences
Exam 1: First Principles198 Questions
Exam 2: Economic Models295 Questions
Exam 3: Supply and Demand264 Questions
Exam 4: Consumer and Producer Surplus228 Questions
Exam 5: Price Controls and Quotas215 Questions
Exam 6: Elasticity88 Questions
Exam 7: Taxes280 Questions
Exam 8: International Trade261 Questions
Exam 9: Decision Making by Individuals and Firms165 Questions
Exam 10: The Rational Consumer197 Questions
Exam 11: Behind the Supply Curve- Inputs and Costs357 Questions
Exam 12: Perfect Competition and the Supply Curve341 Questions
Exam 13: Monopoly316 Questions
Exam 14: Oligopoly272 Questions
Exam 15: Monopolistic Competition246 Questions
Exam 16: Externalities194 Questions
Exam 17: Public Goods and Common Resources180 Questions
Exam 18: The Economics of the Welfare State125 Questions
Exam 19: Factor Markets and the Distribution of Income317 Questions
Exam 20: Uncertainty, risk, and Private Information150 Questions
Exam 21: Graphs in Economics62 Questions
Exam 22: Consumer Preferences153 Questions
Exam 23: Indifference Curve Analysis41 Questions
Select questions type
Use the following to answer questions :
Scenario: Music Downloads and Streamed Movies
Phillip has an income of $300 per month,which he uses to purchase music downloads (MD)and streamed movies (SM).Each music download costs $1 and each streamed movie costs $5.
-(Scenario: Music Downloads and Streamed Movies)Read the scenario Music Downloads and Streamed Movies.Suppose Phillip's income falls by half,and the prices for both music downloads and streamed movies also fall by half.As a result of this,Phillip:
(Multiple Choice)
4.9/5  (39)
(39)
Use the following to answer questions : 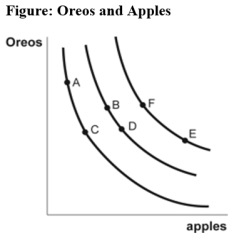 -(Figure: Oreos and Apples)Use Figure Oreos and Apples,which provides an indifference curve map for Diego.As Diego moves along an indifference curve from point F to point E,he buys _____ Oreos to obtain _____ apples.
(Multiple Choice)
4.9/5 (31)
Use the following to answer questions : 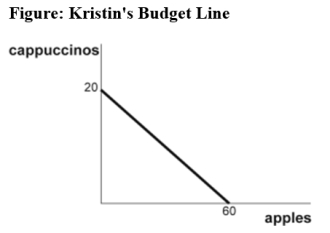 -(Figure: Kristin's Budget Line)Use Figure Kristin's Budget Line.The price of a cup of cappuccino is $3,and the price of an apple is $1.Given her income and the prices of the two goods,Kristin can consume _____ cappuccinos and _____ apples.
(Multiple Choice)
4.8/5 (31)
Use the following to answer questions : 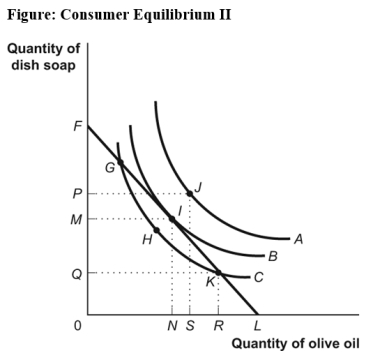 -(Figure: Consumer Equilibrium II)Use Figure Consumer Equilibrium II.Ashyra would maximize her utility at point _____ with the consumption of _____ olive oil and _____ dish soap.
(Multiple Choice)
4.9/5 (37)
A curve that represents combinations of two goods that yield equal levels of satisfaction is a(n):
(Multiple Choice)
4.7/5 (37)
In terms of indifference curves,an increase in total utility is represented by a _____ indifference curve.
(Multiple Choice)
4.8/5 (27)
Suppose Joe derives 327 utils from consuming 1 dozen crab cakes and 11 pairs of socks.If he also derives 327 utils from 2 dozen crab cakes and 5 pairs of socks,Joe is indifferent between those combinations of crab cakes and socks.
(True/False)
4.7/5 (30)
Use the following to answer questions :
Figure: Harold's Indifference Curves
The figure shows three of Harold's indifference curves for bread and cheese. 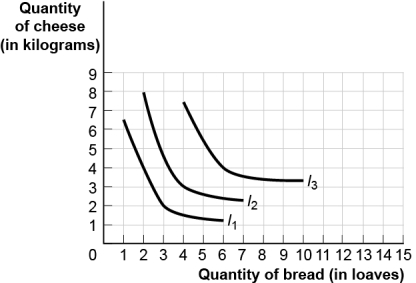 -(Figure: Harold's Indifference Curves)Use Figure Harold's Indifference Curves.If the price of bread is $1 per loaf,the price of cheese is $2 per kilogram,and Harold has $10 to spend on bread and cheese,Harold's optimal consumption bundle is _____ loaves of bread and _____ kilograms of cheese.
(Multiple Choice)
4.7/5 (40)
Use the following to answer questions : 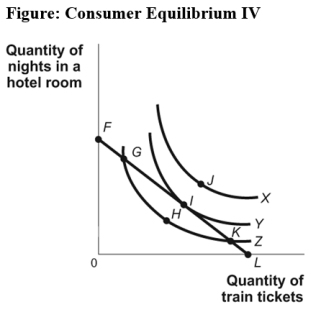 -(Figure: Consumer Equilibrium IV)Use Figure Consumer Equilibrium IV.The highest level of utility shown in the figure is associated with indifference curve:
(Multiple Choice)
4.7/5 (38)
Use the following to answer questions :
Figure: Harold's Indifference Curves
The figure shows three of Harold's indifference curves for bread and cheese.
-(Figure: Harold's Indifference Curves)Use Figure Harold's Indifference Curves.If the price of bread is $1 per loaf,the price of cheese is $2 per kilogram,and Harold has $14 to spend on bread and cheese,Harold's optimal consumption bundle is _____ loaves of bread and _____ kilograms of cheese.
(Multiple Choice)
4.9/5 (30)
Use the following to answer questions : 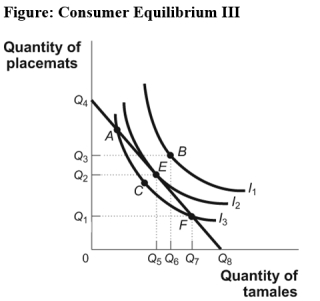 -(Figure: Consumer Equilibrium III)Use Figure Consumer Equilibrium III.The highest level of total utility attainable is associated with point _____ on _____.
(Multiple Choice)
4.8/5 (41)
Use the following to answer question 3:
Figure and Table: An Indifference Curve Map 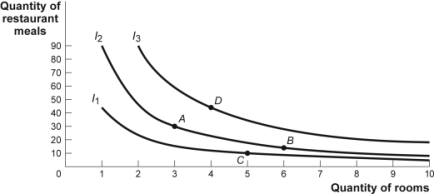 Consumption Bundle Quantity of Rooms Quantity of Meals Total Utility (utils) A 3 30 450 B 6 15 450 C 5 10 391 D 4 45 519
-(Figure and Table: Indifference Curve Map)Use Figure and Table An Indifference Curve Map.Combination _____ is preferred to combination _____.
Consumption Bundle Quantity of Rooms Quantity of Meals Total Utility (utils) A 3 30 450 B 6 15 450 C 5 10 391 D 4 45 519
-(Figure and Table: Indifference Curve Map)Use Figure and Table An Indifference Curve Map.Combination _____ is preferred to combination _____.
(Multiple Choice)
4.9/5 (39)
Use the following to answer questions :
Figure: Harold's Indifference Curves
The figure shows three of Harold's indifference curves for bread and cheese.
-(Figure: Harold's Indifference Curves)Use Figure Harold's Indifference Curves.The price of cheese is $2 per kilogram and Harold has $10 to spend on bread and cheese.As the price of bread rises from $1 to $2 per loaf,his consumption of bread:
(Multiple Choice)
4.8/5 (44)
Use the following to answer questions :
Scenario: Music Downloads and Streamed Movies
Phillip has an income of $300 per month,which he uses to purchase music downloads (MD)and streamed movies (SM).Each music download costs $1 and each streamed movie costs $5.
-(Scenario: Music Downloads and Streamed Movies)Read the scenario Music Downloads and Streamed Movies.The slope of Phillip's budget line is equal to:
(Multiple Choice)
4.9/5 (40)
Because of diminishing marginal utility,indifference curves are convex to the origin.
(True/False)
4.9/5 (33)
Use the following to answer questions :
-(Figure: Consumer Equilibrium III)Use Figure Consumer Equilibrium III.Kurt consumes at point C.If income remains unchanged,Kurt could gain more utility by choosing point:
(Multiple Choice)
4.8/5 (30)
The slope of a(n)_____ curve shows the rate at which two goods can be exchanged _____.
(Multiple Choice)
4.9/5 (42)
Use the following to answer questions :
-(Figure: Consumer Equilibrium III)Use Figure Consumer Equilibrium III.Kurt would maximize his utility at point _____ with the consumption of _____.
(Multiple Choice)
4.8/5 (26)
Use the following to answer questions :
-(Figure: Consumer Equilibrium IV)Use Figure Consumer Equilibrium IV.Assume that you are consuming the combination of goods at point K.Given the budget constraint FL,utility:
(Multiple Choice)
4.8/5 (41)
Use the following to answer questions : 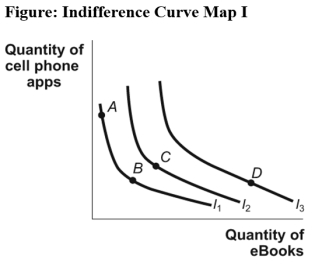 -(Figure: Indifference Curve Map I)Use Figure Indifference Curve Map I.It shows that:
(Multiple Choice)
4.8/5 (34)
Filters
- Essay(0)
- Multiple Choice(0)
- Short Answer(0)
- True False(0)
- Matching(0)