Exam 22: Consumer Preferences
Exam 1: First Principles198 Questions
Exam 2: Economic Models295 Questions
Exam 3: Supply and Demand264 Questions
Exam 4: Consumer and Producer Surplus228 Questions
Exam 5: Price Controls and Quotas215 Questions
Exam 6: Elasticity88 Questions
Exam 7: Taxes280 Questions
Exam 8: International Trade261 Questions
Exam 9: Decision Making by Individuals and Firms165 Questions
Exam 10: The Rational Consumer197 Questions
Exam 11: Behind the Supply Curve- Inputs and Costs357 Questions
Exam 12: Perfect Competition and the Supply Curve341 Questions
Exam 13: Monopoly316 Questions
Exam 14: Oligopoly272 Questions
Exam 15: Monopolistic Competition246 Questions
Exam 16: Externalities194 Questions
Exam 17: Public Goods and Common Resources180 Questions
Exam 18: The Economics of the Welfare State125 Questions
Exam 19: Factor Markets and the Distribution of Income317 Questions
Exam 20: Uncertainty, risk, and Private Information150 Questions
Exam 21: Graphs in Economics62 Questions
Exam 22: Consumer Preferences153 Questions
Exam 23: Indifference Curve Analysis41 Questions
Select questions type
Frank buys only milk and cereal,both of which are normal goods,and he always maximizes his utility.Frank's boss cuts Frank's pay by $200 per month.What happens to Frank's marginal rate of substitution between milk and cereal?
(Multiple Choice)
4.8/5  (38)
(38)
Use the following to answer questions : 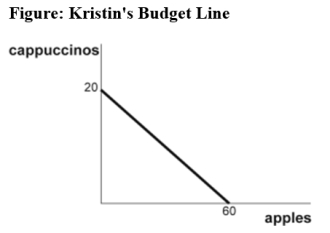 -(Figure: Kristin's Budget Line)Use Figure Kristin's Budget Line.The price of a cup of cappuccino is $3,and the price of an apple is $1.Kristin's income is:
(Multiple Choice)
4.7/5 (26)
Diminishing marginal utility is the reason most indifference curves:
(Multiple Choice)
4.8/5 (35)
Use the following to answer questions : 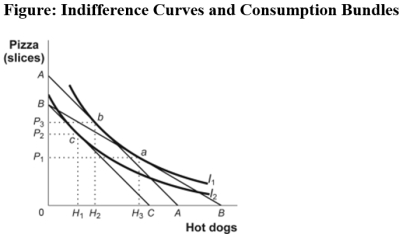 -(Figure: Indifference Curves and Consumption Bundles)Use Figure Indifference Curves and Consumption Bundles.In the figure,the initial optimum is at a.The price of hot dogs now increases.The change in hot dog consumption due to the substitution effect is:
(Multiple Choice)
4.9/5 (41)
If good A is a normal good and its price decreases,the _____ effect(s)will cause a(n)_____ in consumption of it.
(Multiple Choice)
4.9/5 (39)
Use the following to answer questions : Table: Bundles of and Consumption Bundle Quantity of Good X Quantity of Good Y Total Utility (utils) A 2 2 10 B 3 1 10 C 4 4 20 D 1 1 5
-(Table: Bundles of X and Y)Use Table Bundles of X and Y.According to the table:
(Multiple Choice)
4.7/5 (32)
Use the following to answer questions : 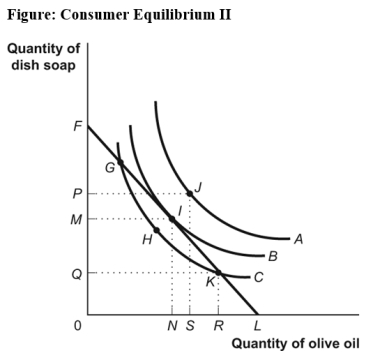 -(Figure: Consumer Equilibrium II)Use Figure Consumer Equilibrium II.The LOWEST level of total utility shown in the figure is associated with point _____ on curve _____.
(Multiple Choice)
4.8/5 (32)
Use the following to answer questions :
-(Figure: Consumer Equilibrium II)Use Figure Consumer Equilibrium II.Which of the following is TRUE?
(Multiple Choice)
4.8/5 (46)
Use the following to answer questions :
Scenario: E-Books and Sports Tickets
Phillip has an income of $300 per month,which he uses to purchase two goods,e-books and sports tickets.Each e-book costs $10,and each sports ticket costs $15.
-(Scenario: E-Books and Sports Tickets)Read the scenario E-Books and Sports Tickets.Phillip gets an increase in the amount of his monthly income allotted for e-books and sports tickets.Holding everything else constant,Phillip's budget line has:
(Multiple Choice)
4.8/5 (33)
Use the following to answer questions :  -Suppose peanut butter is an inferior good for Ilya and the price of peanut butter rises.What will happen to Ilya's consumption of peanut butter?
(Multiple Choice)
4.8/5 (27)
Use the following to answer questions : Table: Madeline's Preferences for T-Shirts and Coffee Consumption Bundle Quantity of T-Shirts Quantity of Coffee (cups) A 30 3 B 24 4 C 21 5 D 19 6 E 18 7
-(Table: Madeline's Preferences for T-Shirts and Coffee)Use Table Madeline's Preferences for T-Shirts and Coffee.Assume each consumption bundle provides the same level of utility.As Madeline moves from bundle A to bundle E,her total utility:
(Multiple Choice)
4.8/5 (34)
Use the following to answer questions : Table: Madeline's Preferences for T-Shirts and Coffee Consumption Bundle Quantity of T-Shirts Quantity of Coffee (cups) A 30 3 B 24 4 C 21 5 D 19 6 E 18 7
-(Table: Madeline's Preferences for T-Shirts and Coffee)Use Table Madeline's Preferences for T-Shirts and Coffee.Assume each consumption bundle provides the same level of utility for Madeline.Suppose Madeline is consuming bundle C.If she changes her purchases to bundle D,this means that she:
(Multiple Choice)
4.7/5 (26)
Use the following to answer questions : 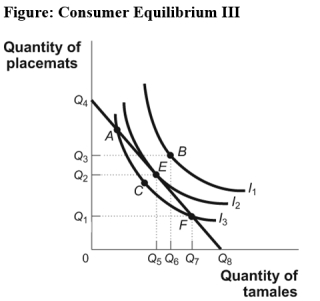 -(Figure: Consumer Equilibrium III)Use Figure Consumer Equilibrium III.Given the figure,which of the following statements is TRUE?
(Multiple Choice)
4.9/5 (27)
Use the following to answer questions : 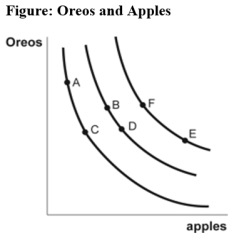 -(Figure: Oreos and Apples)Use Figure Oreos and Apples,which provides an indifference curve map for Diego.The consumption bundle that provides the highest level of utility is bundle:
(Multiple Choice)
4.7/5 (41)
Use the following to answer questions :
-(Figure: Consumer Equilibrium III)Use Figure Consumer Equilibrium III.Given the figure,which of the following is TRUE?
(Multiple Choice)
4.9/5 (40)
Use the following to answer questions : 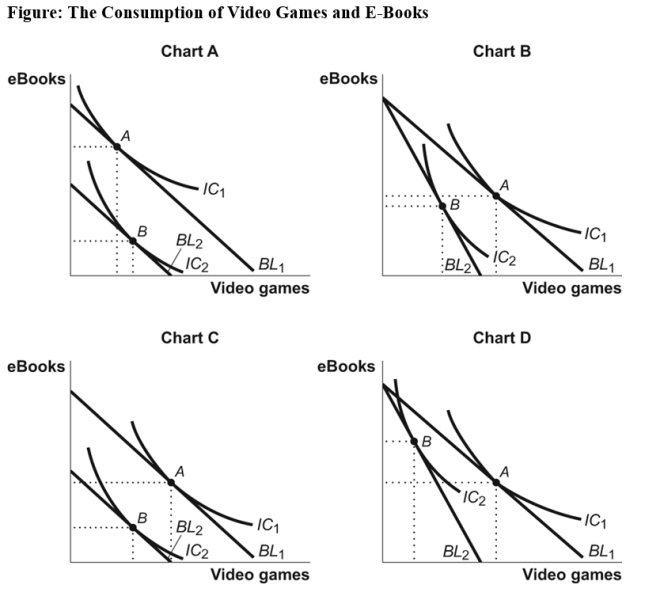 -(Figure: The Consumption of Video Games and E-Books)Use Figure The Consumption of Video Games and E-Books.Which chart shows the effect of a decrease in income when both video games and e-books are normal goods?
(Multiple Choice)
4.8/5 (40)
Use the following to answer questions :
Figure: The Optimal Consumption Bundle  -(Figure: The Optimal Consumption Bundle)Use Figure The Optimal Consumption Bundle.Which of the following could lead to an optimal consumption bundle on indifference curve I1?
(Multiple Choice)
4.7/5 (33)
Which of the following is NOT TRUE of indifference curves for ordinary goods?
(Multiple Choice)
4.9/5 (39)
Use the following to answer questions :
Figure: The Optimal Consumption Bundle
-(Figure: The Optimal Consumption Bundle)Use Figure The Optimal Consumption Bundle.Which of the following could lead to an optimal consumption bundle on indifference curve I3?
(Multiple Choice)
4.8/5 (34)
Filters
- Essay(0)
- Multiple Choice(0)
- Short Answer(0)
- True False(0)
- Matching(0)