Exam 21: Graphs in Economics
Exam 1: First Principles198 Questions
Exam 2: Economic Models295 Questions
Exam 3: Supply and Demand264 Questions
Exam 4: Consumer and Producer Surplus228 Questions
Exam 5: Price Controls and Quotas215 Questions
Exam 6: Elasticity88 Questions
Exam 7: Taxes280 Questions
Exam 8: International Trade261 Questions
Exam 9: Decision Making by Individuals and Firms165 Questions
Exam 10: The Rational Consumer197 Questions
Exam 11: Behind the Supply Curve- Inputs and Costs357 Questions
Exam 12: Perfect Competition and the Supply Curve341 Questions
Exam 13: Monopoly316 Questions
Exam 14: Oligopoly272 Questions
Exam 15: Monopolistic Competition246 Questions
Exam 16: Externalities194 Questions
Exam 17: Public Goods and Common Resources180 Questions
Exam 18: The Economics of the Welfare State125 Questions
Exam 19: Factor Markets and the Distribution of Income317 Questions
Exam 20: Uncertainty, risk, and Private Information150 Questions
Exam 21: Graphs in Economics62 Questions
Exam 22: Consumer Preferences153 Questions
Exam 23: Indifference Curve Analysis41 Questions
Select questions type
Use the following to answer questions : 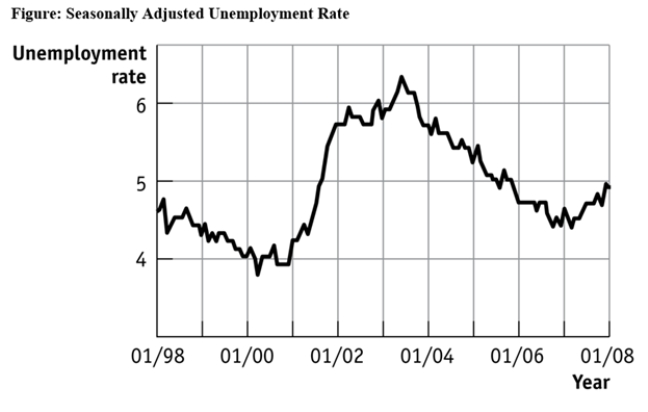 -(Figure: Seasonally Adjusted Unemployment Rate)Use Figure: Seasonally Adjusted Unemployment Rate.The distance between each labeled point on the horizontal axis is 1 year,and the distance between each labeled point on the vertical axis is 1 percentage point of unemployment.What is the approximate slope of the graph between 1/2001 and 1/2003 (using percentage point and years as the units on the vertical and horizontal axes,respectively)?
(Multiple Choice)
4.9/5  (40)
(40)
In looking at a chart of the positive relationship between police officers and crime,the mayor remarks that more police officers cause more crime.The mayor may be wrong because she did not consider:
(Multiple Choice)
4.9/5 (40)
Filters
- Essay(0)
- Multiple Choice(0)
- Short Answer(0)
- True False(0)
- Matching(0)