Exam 4: A Model of Production
Exam 1: Introduction to Macroeconomics35 Questions
Exam 2: Measuring the Macroeconomy111 Questions
Exam 3: An Overview of Long-Run Economic Growth106 Questions
Exam 4: A Model of Production128 Questions
Exam 5: The Solow Growth Model125 Questions
Exam 6: Growth and Ideas114 Questions
Exam 7: The Labor Market, Wages, and Unemployment114 Questions
Exam 8: Inflation111 Questions
Exam 9: An Introduction to the Short Run105 Questions
Exam 10: The Great Recession: a First Look104 Questions
Exam 11: The Is Curve122 Questions
Exam 12: Monetary Policy and the Phillips Curve132 Questions
Exam 13: Stabilization Policy and the Asad Framework109 Questions
Exam 14: The Great Recession and the Short-Run Model104 Questions
Exam 15: Dsge Models: the Frontier of Business Cycle Research114 Questions
Exam 16: Consumption104 Questions
Exam 17: Investment111 Questions
Exam 18: The Government and the Macroeconomy115 Questions
Exam 19: International Trade103 Questions
Exam 20: Exchange Rates and International Finance129 Questions
Exam 21: Parting Thoughts35 Questions
Select questions type
Consider two countries, A and B. If each country produces using identical production functions, but yA = yB and kA = kB, the total factor productivity of country A equals that of B.
(True/False)
4.7/5  (36)
(36)
As an economist working at the International Monetary Fund, you are given the following data for Japan: observed per capita GDP, relative to the United States, is 0.760; predicted per capita GDP, given by , is 1.06. What is total factor productivity?
(Multiple Choice)
4.9/5 (33)
If the marginal product of labor equals the wages, firms should hire more workers.
(True/False)
4.8/5 (38)
What are the shortcomings of using the production model ? What might we include in our model to improve the fit of this simple model?
(Essay)
5.0/5 (33)
Suppose the total factor productivity in Switzerland, Italy, South Africa, and India are 0.89, 0.70, 0.33, and 0.21, respectively. If the U.S. total factor productivity is 1.00, then the United States is ________ productive, respectively, than these four countries.
(Multiple Choice)
4.8/5 (35)
Which of the following is/are essential for economic success?
(Multiple Choice)
4.8/5 (31)
Refer to the following figure when answering
Figure 4.2: The Production Function  -Consider Figure 4.2. The shape of this production function suggests:
(Multiple Choice)
4.8/5 (44)
Refer to the following table when answering
Table 4.1: Production Model's Prediction for Per Capita GDP (US = 1)
Fredicted output Observed per capita, y= per capita GDP Switzerl and 0.966 1.083 United Kingdom 0.828 0.876 Japan 0.760 1.056 Italy 0.686 0.975 Spain 0.661 0.944 Brazil 0.201 0.559 South Africa 0.182 0.546 China 0.172 0.528 India 0.084 0.394 Burundi 0.010 0.180
-One explanation for the difference between the predicted output per person and the observed per capita GDP in Table 4.1 is differences in:
(Multiple Choice)
4.9/5 (33)
As an economist working at the International Monetary Fund, you are given the following data for Burundi: predicted per capita GDP, relative to the United States, as given by , is 0.10, and total factor productivity is 0.083. What is the observed per capita GDP, relative to the United States?
(Multiple Choice)
4.8/5 (37)
You are an economist working for the International Monetary Fund. Your boss wants to know what the total factor productivity of India is, but all you have is data on per capita GDP, y, and the per capita capital stock, k. If you assume that capital's share of GDP is one-fourth, what would you use to find total factor productivity?
(Multiple Choice)
4.9/5 (40)
A production function exhibits decreasing returns to scale if:
(Multiple Choice)
4.7/5 (34)
In the Cobb-Douglas production function , defining y = Y/L as output per person and k = K/L as capital per person, the per person production function is:
(Multiple Choice)
4.9/5 (39)
The two main inputs we consider in a simple production function are:
(Multiple Choice)
4.9/5 (49)
Refer to the following figure when answering
Figure 4.1: Production Function 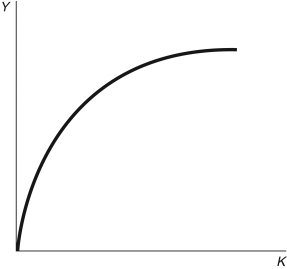 -Consider Figure 4.1. The shape of this production function suggests that in the production function is:
(Multiple Choice)
4.8/5 (36)
As an economist working at the International Monetary Fund, you are given the following data for South Africa: predicted per capita GDP, relative to the United States, as given by , is 0.55, and total factor productivity is 0.33. What is the observed per capita GDP, relative to the United States?
(Multiple Choice)
4.8/5 (34)
Models simplify ________ of decisions into just a few equations.
(Multiple Choice)
4.9/5 (46)
In the equation , the "bars" over the A and K mean that these variables are:
(Multiple Choice)
4.8/5 (34)
Filters
- Essay(0)
- Multiple Choice(0)
- Short Answer(0)
- True False(0)
- Matching(0)