Exam 5: The Solow Growth Model
Exam 1: Introduction to Macroeconomics35 Questions
Exam 2: Measuring the Macroeconomy111 Questions
Exam 3: An Overview of Long-Run Economic Growth106 Questions
Exam 4: A Model of Production128 Questions
Exam 5: The Solow Growth Model125 Questions
Exam 6: Growth and Ideas114 Questions
Exam 7: The Labor Market, Wages, and Unemployment114 Questions
Exam 8: Inflation111 Questions
Exam 9: An Introduction to the Short Run105 Questions
Exam 10: The Great Recession: a First Look104 Questions
Exam 11: The Is Curve122 Questions
Exam 12: Monetary Policy and the Phillips Curve132 Questions
Exam 13: Stabilization Policy and the Asad Framework109 Questions
Exam 14: The Great Recession and the Short-Run Model104 Questions
Exam 15: Dsge Models: the Frontier of Business Cycle Research114 Questions
Exam 16: Consumption104 Questions
Exam 17: Investment111 Questions
Exam 18: The Government and the Macroeconomy115 Questions
Exam 19: International Trade103 Questions
Exam 20: Exchange Rates and International Finance129 Questions
Exam 21: Parting Thoughts35 Questions
Select questions type
Among OECD countries, there is ________ correlation between how poor a country was in 1960 and how fast it ________ from 1960 to 2010.
(Multiple Choice)
4.8/5  (39)
(39)
The steady state is defined as the point where capital accumulation, Kt, is equal to:
(Multiple Choice)
4.9/5 (31)
The steady-state level of output per worker in the Solow model, with the production function , is given by:
(Multiple Choice)
4.7/5 (39)
Refer to the following figure when answering
Figure 5.1: Solow Diagram 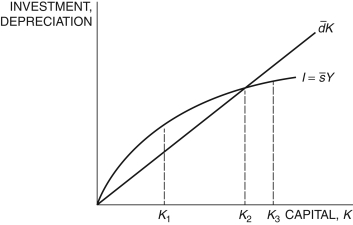 -In Figure 5.1, if the economy begins with the initial capital stock at K2, the capital stock will ________ and the economy will ________.
(Multiple Choice)
4.9/5 (32)
A surprising result of the Solow model is that capital accumulation cannot serve as the engine of growth in the long run.
(True/False)
4.9/5 (34)
Refer to the following figure when answering
Figure 5.3: Solow Diagram 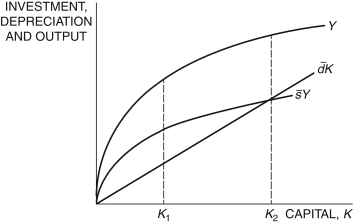 -In Figure 5.3, at K2, capital accumulation is ________, the economy is ________, and consumption is ________.
(Multiple Choice)
4.9/5 (47)
Immediately following the increase in the saving rate, output grows rapidly. As the economy approaches its new steady state:
(Multiple Choice)
4.9/5 (27)
Among the OECD countries, those that were relatively ________ in 1960 ________ between 1960 and 2010.
(Multiple Choice)
4.9/5 (33)
In the Solow model, if a country's saving rate increases, the country:
(Multiple Choice)
4.7/5 (32)
The analysis of how an economy approaches the steady state is called:
(Multiple Choice)
4.8/5 (34)
Suppose that rather than the Cobb-Douglas production function being given as , it is given by
. Find the steady-state level of capital and output in the Solow model.
(Essay)
4.8/5 (41)
In the Solow model, the steady-state level of output per worker is a function of:
(Multiple Choice)
5.0/5 (38)
Immediately following the increase in the investment rate, output grows rapidly. As the economy approaches its new steady state, the growth rate gradually declines.
(True/False)
4.7/5 (42)
In the Solow model, if capital is in the steady state, output:
(Multiple Choice)
4.9/5 (40)
The key difference between the Solow and production models is that the Solow model endogenizes the saving rate.
(True/False)
4.9/5 (39)
In the Solow model, the steady-state capital stock is a function of:
(Multiple Choice)
4.9/5 (38)
Filters
- Essay(0)
- Multiple Choice(0)
- Short Answer(0)
- True False(0)
- Matching(0)