Exam 15: Multiple Regression and Model Building
Exam 1: An Introduction to Business Statistics95 Questions
Exam 2: Descriptive Statistics: Tabular and Graphical Methods85 Questions
Exam 3: Descriptive Statistics: Numerical Methods57 Questions
Exam 4: Probability44 Questions
Exam 5: Discrete Random Variables71 Questions
Exam 6: Continuous Random Variables40 Questions
Exam 7: Sampling and Sampling Distributions52 Questions
Exam 8: Confidence Intervals126 Questions
Exam 9: Hypothesis Testing84 Questions
Exam 10: Statistical Inferences for Means and Proportions70 Questions
Exam 11: Statistical Inferences for Population Variances54 Questions
Exam 12: Experimental Design and Analysis of Variance81 Questions
Exam 13: Chi-Square Tests136 Questions
Exam 14: Simple Linear Regression Analysis95 Questions
Exam 15: Multiple Regression and Model Building119 Questions
Exam 16: Time Series Forecasting and Index Numbers71 Questions
Exam 17: Nonparametric Methods61 Questions
Exam 18: Decision Theory85 Questions
Select questions type
The recurring up-and-down movement of a time series around trend levels that last more than one calendar year is called ____________.
(Multiple Choice)
4.8/5  (38)
(38)
A _______________ index is most useful if the base quantities provide a reasonable representation of consumption patterns in succeeding time periods.
(Multiple Choice)
4.7/5 (31)
Given the following data,compute the total error (sum of the error terms). 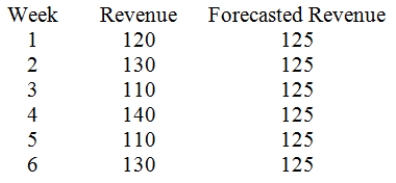
(Essay)
4.8/5 (27)
The demand for a product for the last six years has been 15,15,17,18,20,and 19.The manager wants to predict the demand for this time series using the following simple linear trend equation: trt = 12 + 2t.Use this equation to forecast the demand for this product,and then calculate the MSD.
(Multiple Choice)
4.9/5 (38)
Box-Jenkins methodology is a more sophisticated approach to forecasting a time series with components that might be changing over time.
(True/False)
4.8/5 (31)
Forecasters using a multiplicative decomposition model or time series regression model,assume that the time series components are changing over time.
(True/False)
4.8/5 (41)
A time series decomposition method would not be used to forecast seasonal data.
(True/False)
4.9/5 (36)
Consider a time series with 15 quarterly sales observations.Using the quadratic trend model,the following partial computer output was obtained. 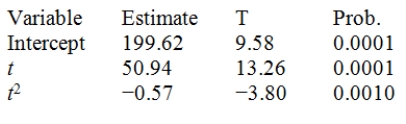 Test the significance of the t2 term at α =.05.State the critical T value (rejection point)and the p-value.Make your decision using a two-sided null hypothesis.
(Essay)
4.9/5 (33)
The Durbin-Watson statistic is used to detect _____________.
(Multiple Choice)
4.8/5 (39)
Exponential smoothing is a forecasting method that applies equal weights to the time series observations.
(True/False)
4.8/5 (36)
Given the following data,compute the total error (sum of the error terms). 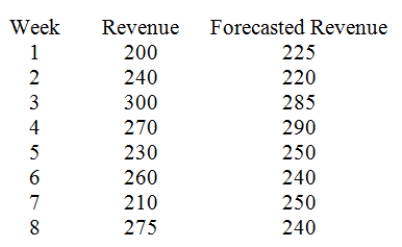
(Essay)
4.8/5 (39)
In general,the number of dummy variables used to model constant seasonal variation is equal to the number of
(Multiple Choice)
4.9/5 (44)
Dummy variables are used to model increasing seasonal variation.
(True/False)
4.7/5 (40)
Consider the following set of quarterly sales data,given in thousands of dollars. 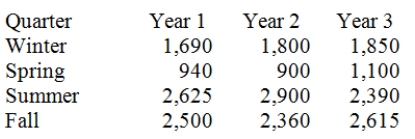 The following dummy variable model that incorporates a linear trend and constant seasonal variation was used: y(t)= B0 + B1t + BQ1(Q1)+ BQ2(Q2)+ BQ3(Q3)+ Et.In this model,there are 3 binary seasonal variables (Q1,Q2,and Q3),where Qi is a binary (0,1)variable defined as:
Qi = 1,if the time series data is associated with quarter i;
Qi = 0,if the time series data is not associated with quarter i.The results associated with this data and model are given in the following Minitab computer output.The regression equation is
Sales = 2442 + 6.2 Time − 693 Q1 − 1499 Q2 + 153 Q3
The following dummy variable model that incorporates a linear trend and constant seasonal variation was used: y(t)= B0 + B1t + BQ1(Q1)+ BQ2(Q2)+ BQ3(Q3)+ Et.In this model,there are 3 binary seasonal variables (Q1,Q2,and Q3),where Qi is a binary (0,1)variable defined as:
Qi = 1,if the time series data is associated with quarter i;
Qi = 0,if the time series data is not associated with quarter i.The results associated with this data and model are given in the following Minitab computer output.The regression equation is
Sales = 2442 + 6.2 Time − 693 Q1 − 1499 Q2 + 153 Q3 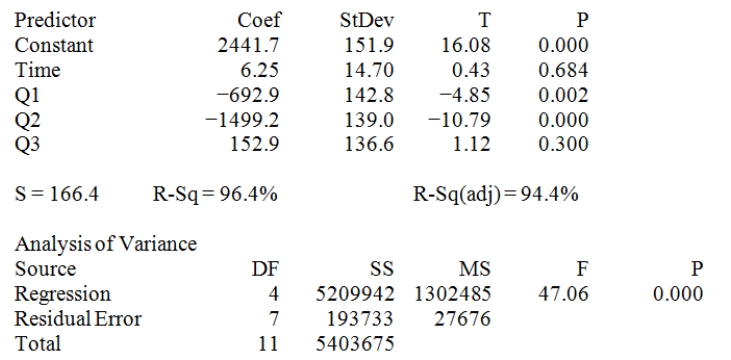 Provide a managerial interpretation of the regression coefficient for the variable "time."
(Essay)
4.7/5 (33)
A univariate time-series model is used to predict future values of a time series based only upon past values of a time series.
(True/False)
4.9/5 (31)
When deseasonalizing a time series observation,we divide the actual time series observation by its ___________.
(Multiple Choice)
4.9/5 (42)
A positive autocorrelation implies that negative error terms will be followed by negative error terms.
(True/False)
4.9/5 (33)
A simple exponential forecasting method would not be used to forecast seasonal data.
(True/False)
4.9/5 (33)
Cyclical variation exists when the magnitude of the seasonal swing does not depend on the level of a time series.
(True/False)
4.7/5 (32)
Filters
- Essay(0)
- Multiple Choice(0)
- Short Answer(0)
- True False(0)
- Matching(0)