Exam 15: Multiple Regression and Model Building
Exam 1: An Introduction to Business Statistics95 Questions
Exam 2: Descriptive Statistics: Tabular and Graphical Methods85 Questions
Exam 3: Descriptive Statistics: Numerical Methods57 Questions
Exam 4: Probability44 Questions
Exam 5: Discrete Random Variables71 Questions
Exam 6: Continuous Random Variables40 Questions
Exam 7: Sampling and Sampling Distributions52 Questions
Exam 8: Confidence Intervals126 Questions
Exam 9: Hypothesis Testing84 Questions
Exam 10: Statistical Inferences for Means and Proportions70 Questions
Exam 11: Statistical Inferences for Population Variances54 Questions
Exam 12: Experimental Design and Analysis of Variance81 Questions
Exam 13: Chi-Square Tests136 Questions
Exam 14: Simple Linear Regression Analysis95 Questions
Exam 15: Multiple Regression and Model Building119 Questions
Exam 16: Time Series Forecasting and Index Numbers71 Questions
Exam 17: Nonparametric Methods61 Questions
Exam 18: Decision Theory85 Questions
Select questions type
The following data on prices and quantities for the years 1995 and 2000 are given for three products. 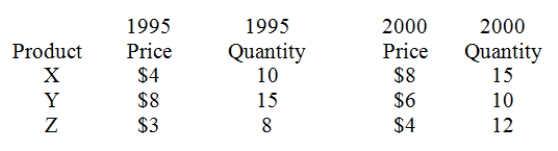 Calculate the 2000 aggregate price index.
(Essay)
4.7/5  (32)
(32)
A simple index is obtained by dividing the current value of a time series by the value of a time series in the _____________ time period and by multiplying this ratio by 100.
(Multiple Choice)
4.8/5 (34)
If the errors produced by a forecasting method for 3 observations are +3,+3,and −3,then what is the mean absolute deviation?
(Multiple Choice)
4.8/5 (37)
If the errors produced by a forecasting method for 3 observations are +3,+3,and −3,then what is the mean squared error?
(Multiple Choice)
4.7/5 (42)
In the multiplicative decomposition method,the centered moving averages provide an estimate of a trend's ____________.
(Multiple Choice)
4.8/5 (42)
Two forecasting models were used to predict the future values of a time series.The forecasts are shown below with the actual values. 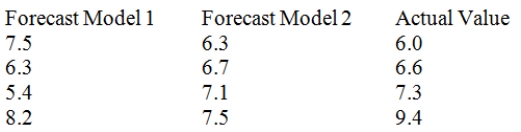 Calculate the mean squared deviation (MSD)for Model 1.
(Essay)
4.9/5 (36)
If a time series exhibits increasing seasonal variation,one approach is to first use a(n)______________ transformation that produces a transformed time series that exhibits constant seasonal variation.Then,_________ variables can be used to model the time series with constant seasonal variation.
(Multiple Choice)
4.9/5 (38)
Based on the following data,a forecaster used simple exponential smoothing and determined the following: S0 = 19,S1 = 18.6,S2 = 19.08,S3 = 19.064,S4 = 19.851,and S5 = 19.481. 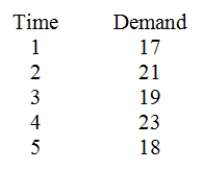 Calculate the Mean Squared Deviation (MSD or MSE).
(Essay)
4.8/5 (30)
The smoothing constant is a number that determines how much weight is attached to each observation.
(True/False)
4.7/5 (33)
Multiplicative decompositions assumes that time series components remain essentially constant over time.
(True/False)
4.8/5 (41)
The Box-Jenkins methodology can be used to identify what is called an autoregressive-moving average model.
(True/False)
4.8/5 (37)
Dummy variable regression would be an appropriate method to use to forecast a time series that exhibits a linear trend with no seasonal or cyclical patterns.
(True/False)
4.7/5 (29)
Two forecasting models were used to predict the future values of a time series.The forecasts are shown below with the actual values.  Calculate the mean squared deviation (MSD)for Model 2
(Essay)
4.8/5 (24)
Simple exponential smoothing is a forecasting method that applies equal weights to the time series observations.
(True/False)
4.9/5 (31)
Consider the following set of quarterly sales data,given in thousands of dollars. 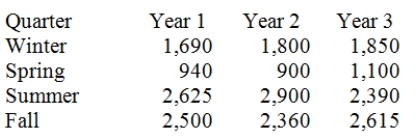 The following dummy variable model that incorporates a linear trend and constant seasonal variation was used: y(t)= B0 + B1t + BQ1(Q1)+ BQ2(Q2)+ BQ3(Q3)+ Et.In this model,there are 3 binary seasonal variables (Q1,Q2,and Q3),where Qi is a binary (0,1)variable defined as:
Qi = 1,if the time series data is associated with quarter i;
Qi = 0,if the time series data is not associated with quarter i.The results associated with this data and model are given in the following Minitab computer output.The regression equation is
Sales = 2442 + 6.2Time − 693Q1 − 1499Q2 + 153Q3
The following dummy variable model that incorporates a linear trend and constant seasonal variation was used: y(t)= B0 + B1t + BQ1(Q1)+ BQ2(Q2)+ BQ3(Q3)+ Et.In this model,there are 3 binary seasonal variables (Q1,Q2,and Q3),where Qi is a binary (0,1)variable defined as:
Qi = 1,if the time series data is associated with quarter i;
Qi = 0,if the time series data is not associated with quarter i.The results associated with this data and model are given in the following Minitab computer output.The regression equation is
Sales = 2442 + 6.2Time − 693Q1 − 1499Q2 + 153Q3 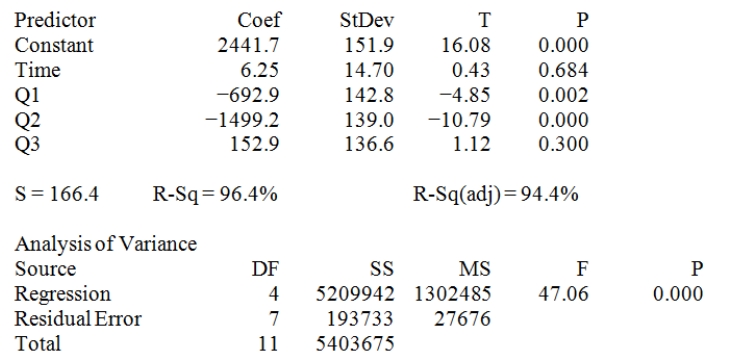 Provide a managerial interpretation of the regression coefficients for the variables Q1 (quarter 1),Q2 (quarter 2),and Q3 (quarter 3).
(Essay)
4.8/5 (26)
A sequence of values of some variable or composite of variables taken at successive,uninterrupted time periods is called a
(Multiple Choice)
4.8/5 (37)
Simple exponential smoothing is an appropriate method for prediction purposes when there is a significant trend present in a time series.
(True/False)
4.8/5 (41)
Consider the quarterly production data (in thousands of units)for the XYZ manufacturing company below. 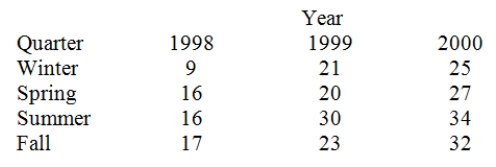 Calculate the 4-period (quarter)centered moving average for the entire time series.
(Essay)
4.8/5 (33)
Filters
- Essay(0)
- Multiple Choice(0)
- Short Answer(0)
- True False(0)
- Matching(0)