Exam 13: Chi-Square Tests
Exam 1: An Introduction to Business Statistics95 Questions
Exam 2: Descriptive Statistics: Tabular and Graphical Methods85 Questions
Exam 3: Descriptive Statistics: Numerical Methods57 Questions
Exam 4: Probability44 Questions
Exam 5: Discrete Random Variables71 Questions
Exam 6: Continuous Random Variables40 Questions
Exam 7: Sampling and Sampling Distributions52 Questions
Exam 8: Confidence Intervals126 Questions
Exam 9: Hypothesis Testing84 Questions
Exam 10: Statistical Inferences for Means and Proportions70 Questions
Exam 11: Statistical Inferences for Population Variances54 Questions
Exam 12: Experimental Design and Analysis of Variance81 Questions
Exam 13: Chi-Square Tests136 Questions
Exam 14: Simple Linear Regression Analysis95 Questions
Exam 15: Multiple Regression and Model Building119 Questions
Exam 16: Time Series Forecasting and Index Numbers71 Questions
Exam 17: Nonparametric Methods61 Questions
Exam 18: Decision Theory85 Questions
Select questions type
Based on 25 time-ordered observations from a simple regression model,we have determined the Durbin-Watson statistic,d = 1.39.At α = .05,test to determine if there is any evidence of positive autocorrelation.State your conclusions.
(Essay)
4.8/5  (30)
(30)
An experiment was performed on a certain metal to determine if the strength is a function of heating time.Results based on 10 metal sheets are given below.Use the simple linear regression model.  Calculate the 95 percent confidence interval for the slope.
(Essay)
4.8/5 (37)
An experiment was performed on a certain metal to determine if the strength is a function of heating time.Results based on 10 metal sheets are given below.  Using the simple linear regression model,find the estimated y-intercept.
(Essay)
4.8/5 (38)
The error term is the difference between an individual value of the dependent variable and the corresponding mean value of the dependent variable.
(True/False)
4.8/5 (42)
Regression Analysis 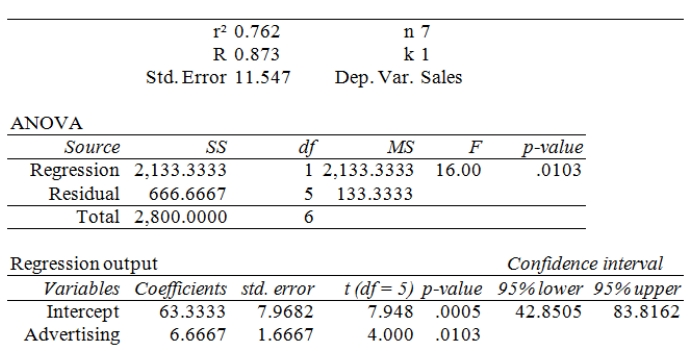 A local grocery store wants to predict its daily sales in dollars.The manager believes that the amount of newspaper advertising significantly affects sales.He randomly selects 7 days of data consisting of daily grocery store sales (in thousands of dollars)and advertising expenditures (in thousands of dollars).The Excel/MegaStat output given above summarizes the results of the regression model.What is the estimated simple linear regression equation?
(Essay)
4.9/5 (37)
The least squares regression line minimizes the sum of the
(Multiple Choice)
4.7/5 (33)
Consider the following partial computer output from a simple linear regression analysis.  What is the estimated slope?
(Short Answer)
4.9/5 (38)
An experiment was performed on a certain metal to determine if the strength is a function of heating time.Results based on 10 metal sheets are given below.Use the simple linear regression model.  Determine the standard error.
(Essay)
4.8/5 (35)
The correlation coefficient is the ratio of explained variation to total variation.
(True/False)
4.8/5 (37)
Consider the following partial computer output from a simple linear regression analysis. 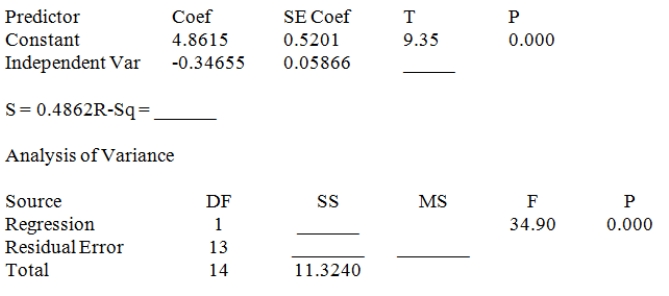 Calculate the t statistic used to test H0: β1 = 0 versus Ha: β1 ≠ 0 at α = .001.
(Essay)
4.9/5 (35)
When there is positive autocorrelation,over time,negative error terms are followed by positive error terms and positive error terms are followed by negative error terms.
(True/False)
4.9/5 (45)
An experiment was performed on a certain metal to determine if the strength is a function of heating time.The sample size consists of 10 metal sheets.The simple linear regression equation is
= 1 + 1X.The time is in minutes and the strength is measured in pounds per square inch.One of the 10 metal sheets was heated for 4 minutes and the resulting strength was 6 lb per square inch.Calculate the value of the residual for this observation.
(Essay)
4.9/5 (30)
The following results were obtained from a simple regression analysis.Ŷ = 37.2895 − 1.2024X
r2 = .6744 sb = .2934
For each unit change in X (independent variable),what is the estimated change in Y (dependent variable)?
(Essay)
4.9/5 (34)
Complete the following partial ANOVA table from a simple linear regression analysis with a sample size of 16 observations.Find the F statistic to test the significance of the model. 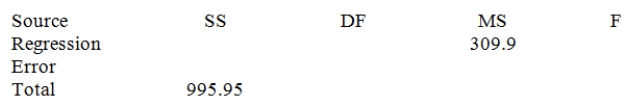
(Essay)
4.7/5 (36)
Consider the following partial computer output from a simple linear regression analysis with a sample size of 16 observations.Find the t test to test the significance of the model. 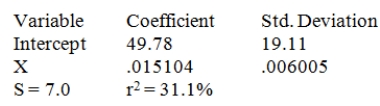
(Essay)
4.7/5 (33)
In a simple linear regression analysis,the correlation coefficient (a)and the slope (b)___________ have the same sign.
(Multiple Choice)
4.7/5 (37)
The _____________ measures the strength of the linear relationship between the dependent variable and the independent variable.
(Multiple Choice)
4.8/5 (40)
The experimental region is the range of the previously observed values of the dependent variable.
(True/False)
4.8/5 (40)
The dependent variable is the variable that is being described,predicted,or controlled.
(True/False)
4.9/5 (45)
In a simple linear regression model,the intercept term is the mean value of y when x equals _____.
(Multiple Choice)
4.8/5 (30)
Filters
- Essay(0)
- Multiple Choice(0)
- Short Answer(0)
- True False(0)
- Matching(0)