Exam 13: Chi-Square Tests
Exam 1: An Introduction to Business Statistics95 Questions
Exam 2: Descriptive Statistics: Tabular and Graphical Methods85 Questions
Exam 3: Descriptive Statistics: Numerical Methods57 Questions
Exam 4: Probability44 Questions
Exam 5: Discrete Random Variables71 Questions
Exam 6: Continuous Random Variables40 Questions
Exam 7: Sampling and Sampling Distributions52 Questions
Exam 8: Confidence Intervals126 Questions
Exam 9: Hypothesis Testing84 Questions
Exam 10: Statistical Inferences for Means and Proportions70 Questions
Exam 11: Statistical Inferences for Population Variances54 Questions
Exam 12: Experimental Design and Analysis of Variance81 Questions
Exam 13: Chi-Square Tests136 Questions
Exam 14: Simple Linear Regression Analysis95 Questions
Exam 15: Multiple Regression and Model Building119 Questions
Exam 16: Time Series Forecasting and Index Numbers71 Questions
Exam 17: Nonparametric Methods61 Questions
Exam 18: Decision Theory85 Questions
Select questions type
For the same value of X (independent variable),the confidence interval for the average value of Y (dependent variable)is __________________ the prediction interval for the individual value of Y.
(Multiple Choice)
4.9/5  (41)
(41)
An experiment was performed on a certain metal to determine if the strength is a function of heating time.The sample size consists of 10 metal sheets.Residuals are calculated for all 10 sheets and ordered from smallest to largest.Determine the normal point for the smallest residual.
(Essay)
4.7/5 (36)
Consider the following partial computer output from a simple linear regression analysis. 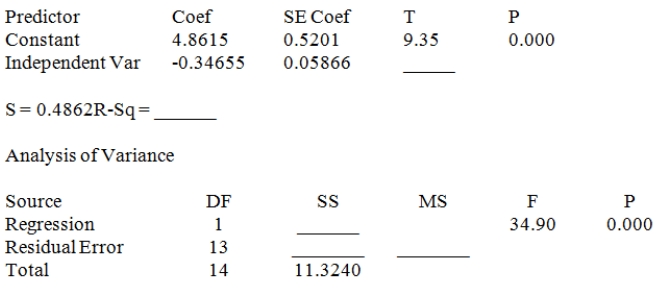 Write the equation of the least squares line.
(Short Answer)
4.9/5 (33)
Consider the following partial computer output from a simple linear regression analysis.  Determine the 95 percent prediction interval for the mean value of y when x = 9.00.Givens: ∑x = 129.03,∑x2 = 1178.547
(Essay)
4.8/5 (35)
The standard error of the estimate (standard error)is the estimated standard deviation of the distribution of the independent variable (X)for all values of the dependent variable (Y).
(True/False)
4.9/5 (43)
A ______________________ measures the strength of the relationship between a dependent variable (Y)and an independent variable (X).
(Multiple Choice)
4.8/5 (34)
In a simple linear regression model,the slope term is the change in the mean value of y associated with _____________ in x.
(Multiple Choice)
4.7/5 (40)
A data set with 7 observations yielded the following.Use the simple linear regression model. 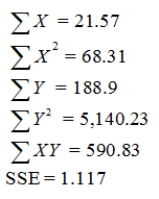 Find the estimated y-intercept.
(Essay)
4.7/5 (43)
An experiment was performed on a certain metal to determine if the strength is a function of heating time.Partial results based on a sample of 10 metal sheets are given below.The simple linear regression equation is
 = 1 + 1X.The time is in minutes,the strength is measured in pounds per square inch,MSE = 0.5,
 = 30,and
 = 104.Determine the 95 percent prediction interval for the strength of a metal sheet when the average heating time is 2.5 minutes.
(Essay)
4.9/5 (32)
Regression analysis.  A local grocery store wants to predict its daily sales in dollars.The manager believes that the amount of newspaper advertising significantly affects sales.He randomly selects 7 days of data consisting of daily grocery store sales (in thousands of dollars)and advertising expenditures (in thousands of dollars).The Excel/MegaStat output given above summarizes the results of the regression model.What are the limits of the 99 percent prediction interval of the daily sales in dollars of an individual grocery store that has spent $3,000 on advertising expenditures? The distance value for this particular prediction is reported as .164.
(Essay)
4.7/5 (49)
Regression Analysis 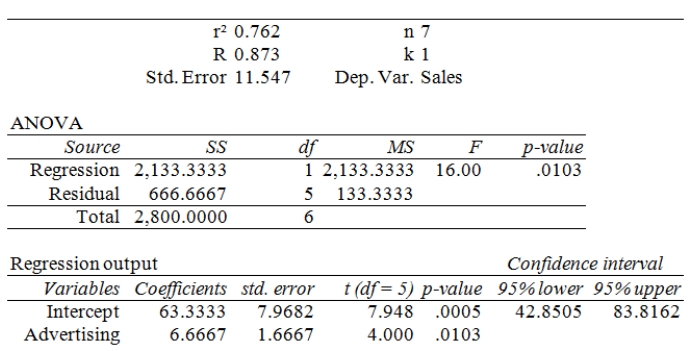 A local grocery store wants to predict its daily sales in dollars.The manager believes that the amount of newspaper advertising significantly affects sales.He randomly selects 7 days of data consisting of daily grocery store sales (in thousands of dollars)and advertising expenditures (in thousands of dollars).The Excel/MegaStat output given above summarizes the results of the regression model.If the manager decides to spend $3,000 on advertising,based on the simple linear regression results given above,what are the estimated sales?
(Essay)
4.7/5 (35)
A significant positive correlation between X and Y implies that changes in X cause Y to change.
(True/False)
4.8/5 (36)
The least squares simple linear regression line minimizes the sum of the vertical deviations between the line and the data points.
(True/False)
4.8/5 (39)
A local tire dealer wants to predict the number of tires sold each month.He believes that the number of tires sold is a linear function of the amount of money invested in advertising.He randomly selects 6 months of data consisting of tire sales (in thousands of tires)and advertising expenditures (in thousands of dollars).Based on the data set with 6 observations,the simple linear regression model yielded the following results. 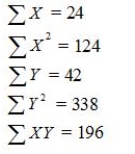 Determine the value of the F statistic.
(Essay)
4.8/5 (42)
After plotting the data points on a scatter diagram,we have observed an inverse relationship between the independent variable (X)and the dependent variable (Y).Therefore,we can expect both the sample ___________ and the sample _____________ to be negative values.
(Multiple Choice)
4.9/5 (46)
The residual is the difference between the observed value of the dependent variable and the predicted value of the dependent variable.
(True/False)
4.8/5 (37)
If one of the assumptions of the regression model is violated,performing data transformations on the ____________ can remedy the situation.
(Multiple Choice)
4.9/5 (42)
The simple coefficient of determination is the proportion of total variation explained by the regression line.
(True/False)
4.8/5 (35)
Consider the following partial computer output from a simple linear regression analysis. 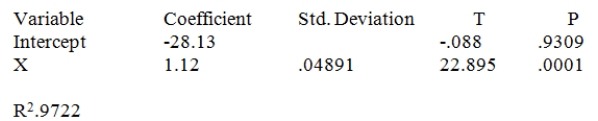 Test H0: β1 ≤ 0 vs.Ha: β1 > 0.
(Essay)
4.8/5 (41)
An experiment was performed on a certain metal to determine if the strength is a function of heating time.Results based on 10 metal sheets are given below. 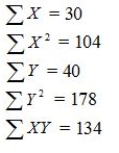 Using the simple linear regression model,find the estimated y-intercept and slope and write the equation of the least squares regression line.
(Essay)
4.9/5 (44)
Filters
- Essay(0)
- Multiple Choice(0)
- Short Answer(0)
- True False(0)
- Matching(0)