Exam 13: Chi-Square Tests
Exam 1: An Introduction to Business Statistics95 Questions
Exam 2: Descriptive Statistics: Tabular and Graphical Methods85 Questions
Exam 3: Descriptive Statistics: Numerical Methods57 Questions
Exam 4: Probability44 Questions
Exam 5: Discrete Random Variables71 Questions
Exam 6: Continuous Random Variables40 Questions
Exam 7: Sampling and Sampling Distributions52 Questions
Exam 8: Confidence Intervals126 Questions
Exam 9: Hypothesis Testing84 Questions
Exam 10: Statistical Inferences for Means and Proportions70 Questions
Exam 11: Statistical Inferences for Population Variances54 Questions
Exam 12: Experimental Design and Analysis of Variance81 Questions
Exam 13: Chi-Square Tests136 Questions
Exam 14: Simple Linear Regression Analysis95 Questions
Exam 15: Multiple Regression and Model Building119 Questions
Exam 16: Time Series Forecasting and Index Numbers71 Questions
Exam 17: Nonparametric Methods61 Questions
Exam 18: Decision Theory85 Questions
Select questions type
A local tire dealer wants to predict the number of tires sold each month.He believes that the number of tires sold is a linear function of the amount of money invested in advertising.He randomly selects 6 months of data consisting of tire sales (in thousands of tires)and advertising expenditures (in thousands of dollars).Based on the data set with 6 observations,the simple linear regression equation of the least squares line is ŷ = 3 + 1x. 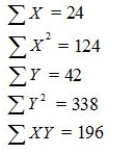 MSE = 4
Use the least squares regression equation and estimate the monthly tire sales when advertising expenditures = $4,000.
MSE = 4
Use the least squares regression equation and estimate the monthly tire sales when advertising expenditures = $4,000.
(Short Answer)
4.8/5  (31)
(31)
A local tire dealer wants to predict the number of tires sold each month.He believes that the number of tires sold is a linear function of the amount of money invested in advertising.He randomly selects 6 months of data consisting of monthly tire sales (in thousands of tires)and monthly advertising expenditures (in thousands of dollars).The simple linear regression equation is ŷ = 3 + 1x.The dealer randomly selects one of the six observations,with a monthly sales value of 8,000 tires and monthly advertising expenditures of $7,000.Calculate the value of the residual for this observation.
(Essay)
4.7/5 (35)
In simple regression analysis,the standard error is ___________ greater than the standard deviation of y values.
(Multiple Choice)
4.9/5 (30)
In simple regression analysis,the quantity is called the __________ sum of squares.
(Multiple Choice)
4.8/5 (39)
An experiment was performed on a certain metal to determine if the strength is a function of heating time.Partial results based on a sample of 10 metal sheets are given below.The simple linear regression equation is
 = 1 + 1X.The time is in minutes,the strength is measured in pounds per square inch,MSE = 0.5,
 = 30,and
 = 104.Determine the 95 percent confidence interval for the average strength of a metal sheet when the average heating time is 2.5 minutes.
(Essay)
4.8/5 (33)
The ____________________ is the proportion of the total variation in the dependent variable explained by the regression model.
(Multiple Choice)
4.9/5 (37)
Consider the following partial computer output from a simple linear regression analysis. 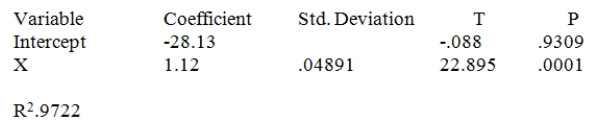 Calculate the correlation coefficient.
(Essay)
4.8/5 (42)
A data set with 7 observations yielded the following.Use the simple linear regression model. 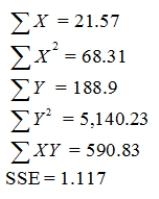 Calculate the coefficient of determination.
(Essay)
4.9/5 (34)
Which of the following is a violation of the independence assumption?
(Multiple Choice)
5.0/5 (27)
In simple regression analysis,if the correlation coefficient is a positive value,then
(Multiple Choice)
4.8/5 (41)
A local tire dealer wants to predict the number of tires sold each month.He believes that the number of tires sold is a linear function of the amount of money invested in advertising.He randomly selects 6 months of data consisting of tire sales (in thousands of tires)and advertising expenditures (in thousands of dollars).Based on the data set with 6 observations,the simple linear regression equation of the least squares line is ŷ = 3 + 1x. 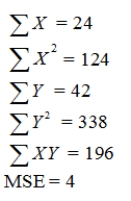 Using the sums of the squares given above,determine the 95 percent confidence interval for the slope.
(Essay)
5.0/5 (32)
The following results were obtained as part of a simple regression analysis.r2 = .9162 F statistic from the F table = 3.59
Calculated value of F from the ANOVA table = 81.87
Α = .05
P-value = .000
The null hypothesis of no linear relationship between the dependent variable and the independent variable
(Multiple Choice)
4.9/5 (36)
The ____________ assumption requires that all variation around the regression line should be equal at all possible values (levels)of the ___________variable.
(Multiple Choice)
4.8/5 (35)
Regression Analysis 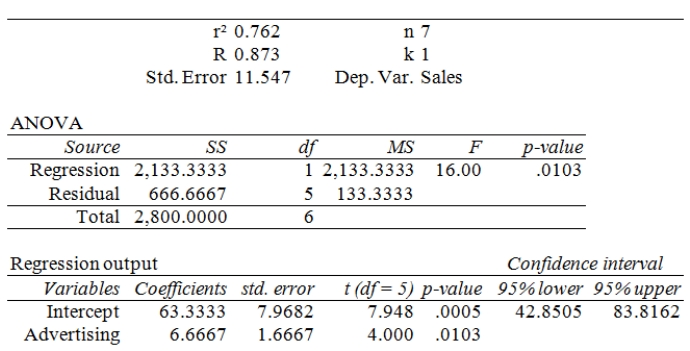 A local grocery store wants to predict its daily sales in dollars.The manager believes that the amount of newspaper advertising significantly affects sales.He randomly selects 7 days of data consisting of daily grocery store sales (in thousands of dollars)and advertising expenditures (in thousands of dollars).The Excel/MegaStat output given above summarizes the results of the regression model.What are the limits of the 95 percent confidence interval for the population slope?
(Essay)
4.8/5 (38)
When the assumption of __________ residuals (error terms)is violated,the Durbin-Watson statistic is used to test to determine if there is significant _____________ among the residuals.
(Multiple Choice)
4.8/5 (26)
The estimated simple linear regression equation minimizes the sum of the squared deviations between each value of Y and the line.
(True/False)
4.9/5 (42)
The simple linear regression (least squares method)minimizes
(Multiple Choice)
4.7/5 (42)
When using simple linear regression,we would like to use confidence intervals for the ___________ and prediction intervals for the ___________ at a given value of x.
(Multiple Choice)
4.8/5 (33)
A local tire dealer wants to predict the number of tires sold each month.He believes that the number of tires sold is a linear function of the amount of money invested in advertising.He randomly selects 6 months of data consisting of tire sales (in thousands of tires)and advertising expenditures (in thousands of dollars).Based on the data set with 6 observations,the simple linear regression model yielded the following results.  Calculate the standard error.
(Essay)
4.8/5 (38)
The ___________ the r2 and the __________ the s (standard error),the stronger the relationship between the dependent variable and the independent variable.
(Multiple Choice)
4.9/5 (39)
Filters
- Essay(0)
- Multiple Choice(0)
- Short Answer(0)
- True False(0)
- Matching(0)