Exam 2: Descriptive Statistics: Tabular and Graphical Methods
Exam 1: An Introduction to Business Statistics95 Questions
Exam 2: Descriptive Statistics: Tabular and Graphical Methods85 Questions
Exam 3: Descriptive Statistics: Numerical Methods57 Questions
Exam 4: Probability44 Questions
Exam 5: Discrete Random Variables71 Questions
Exam 6: Continuous Random Variables40 Questions
Exam 7: Sampling and Sampling Distributions52 Questions
Exam 8: Confidence Intervals126 Questions
Exam 9: Hypothesis Testing84 Questions
Exam 10: Statistical Inferences for Means and Proportions70 Questions
Exam 11: Statistical Inferences for Population Variances54 Questions
Exam 12: Experimental Design and Analysis of Variance81 Questions
Exam 13: Chi-Square Tests136 Questions
Exam 14: Simple Linear Regression Analysis95 Questions
Exam 15: Multiple Regression and Model Building119 Questions
Exam 16: Time Series Forecasting and Index Numbers71 Questions
Exam 17: Nonparametric Methods61 Questions
Exam 18: Decision Theory85 Questions
Select questions type
An analytic dashboard presents both current and historical trends of a business's key performance indicators.
(True/False)
4.8/5  (35)
(35)
The number of items rejected daily by a manufacturer because of defects for the last 30 days are:
20,21,8,17,22,19,18,19,14,17,11,6,21,25,4,19,9,12,16,16,10,28,24,6,21,20,25,5,17,8
Construct a stem-and-leaf plot.
(Essay)
4.8/5 (30)
Beginning the vertical scale of a graph at a value different from zero can cause increases to look more dramatic.
(True/False)
4.8/5 (35)
It is possible to create different interpretations of the same graphical display by simply using different captions.
(True/False)
4.8/5 (36)
If there are 62 values in a data set,how many classes should be created for a frequency histogram?
(Multiple Choice)
4.9/5 (35)
If there are 130 values in a data set,how many classes should be created for a frequency histogram?
(Multiple Choice)
4.9/5 (35)
Fill in the missing components of the following frequency distribution constructed for a sample size of 50. 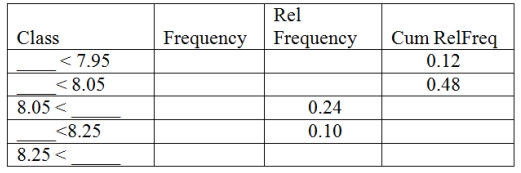
(Essay)
4.9/5 (29)
When looking at the shape of the distribution using a stem-and-leaf,a distribution is skewed to the right when the left tail is shorter than the right tail.
(True/False)
4.8/5 (32)
A histogram that tails out toward larger values is ___________.
(Multiple Choice)
4.8/5 (35)
The number of weekly sales calls by a sample of 25 pharmaceutical salespersons is below.24,56,43,35,37,27,29,44,34,28,33,28,46,31,38,41,48,38,27,29,37,33,31,40,50
Construct a frequency polygon.
(Essay)
4.8/5 (30)
A local electronics retailer recently conducted a study on purchasers of large screen televisions.The study recorded the type of television and the credit account balance of the customer at the time of purchase.They obtained the following results. 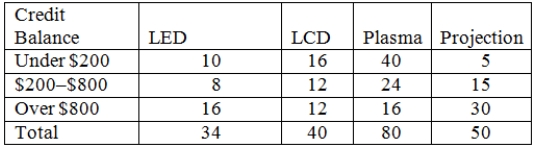 Construct a table of row percentages.
(Essay)
4.8/5 (35)
A stem-and-leaf display is a graphical portrayal of a data set that shows the data set's overall pattern of variation.
(True/False)
4.7/5 (39)
The percentage of measurements in a class is called the ___________ of that class.
(Multiple Choice)
4.9/5 (35)
When grouping a large sample of measurements into classes,the ______________ is a better tool than the ___________.
(Multiple Choice)
4.7/5 (22)
Which of the following dashboard graphical methods will show variation over time?
(Multiple Choice)
4.8/5 (32)
If space is an issue when presenting analytic dashboard graphics,gauges should be used most frequently.
(True/False)
4.9/5 (27)
Stem-and-leaf displays and dot plots are useful for detecting outliers.
(True/False)
4.8/5 (31)
Treemaps are used to display qualitative measures of performance.
(True/False)
4.7/5 (26)
Filters
- Essay(0)
- Multiple Choice(0)
- Short Answer(0)
- True False(0)
- Matching(0)