Exam 2: Descriptive Statistics: Tabular and Graphical Methods
Exam 1: An Introduction to Business Statistics95 Questions
Exam 2: Descriptive Statistics: Tabular and Graphical Methods85 Questions
Exam 3: Descriptive Statistics: Numerical Methods57 Questions
Exam 4: Probability44 Questions
Exam 5: Discrete Random Variables71 Questions
Exam 6: Continuous Random Variables40 Questions
Exam 7: Sampling and Sampling Distributions52 Questions
Exam 8: Confidence Intervals126 Questions
Exam 9: Hypothesis Testing84 Questions
Exam 10: Statistical Inferences for Means and Proportions70 Questions
Exam 11: Statistical Inferences for Population Variances54 Questions
Exam 12: Experimental Design and Analysis of Variance81 Questions
Exam 13: Chi-Square Tests136 Questions
Exam 14: Simple Linear Regression Analysis95 Questions
Exam 15: Multiple Regression and Model Building119 Questions
Exam 16: Time Series Forecasting and Index Numbers71 Questions
Exam 17: Nonparametric Methods61 Questions
Exam 18: Decision Theory85 Questions
Select questions type
______________ and _____________ are used to describe qualitative (categorical)data.
(Multiple Choice)
4.8/5  (35)
(35)
The number of items rejected daily by a manufacturer because of defects for the last 30 days are:
20,21,8,17,22,19,18,19,14,17,11,6,21,25,4,19,9,12,16,16,10,28,24,6,21,20,25,5,17,8
Complete this frequency table for these data. 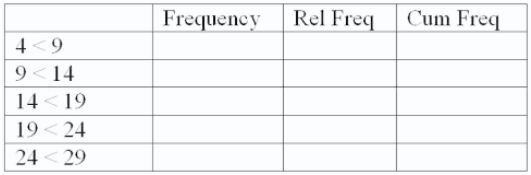
(Essay)
5.0/5 (30)
Consider the following data. 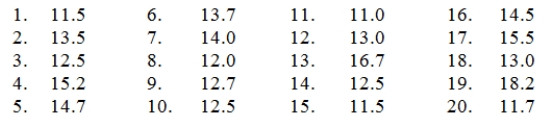 Create a stem-and-leaf display for the sample.
(Essay)
4.8/5 (33)
When we wish to summarize the proportion (or fraction)of items in a class,we use the frequency distribution for each class.
(True/False)
4.7/5 (28)
Splitting the stems refers to assigning the same stem to two or more rows of the stem-and-leaf display.
(True/False)
4.8/5 (37)
The following is a relative frequency distribution of grades in an introductory statistics course. 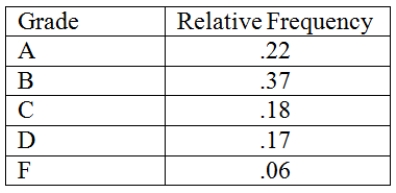 If this was the distribution of 200 students,give the frequency distribution for this data.
(Essay)
4.9/5 (38)
Consider the following data on distances traveled by people to visit the local amusement park. 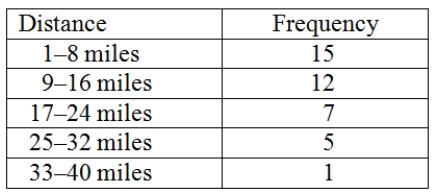 Construct an ogive plot that corresponds to the frequency table.
(Essay)
4.9/5 (34)
The relative frequency is the frequency of a class divided by the total number of measurements.
(True/False)
4.8/5 (33)
All of the following are used to describe quantitative data except the ___________.
(Multiple Choice)
4.8/5 (36)
Math test anxiety can be found throughout the general population.A study of 116 seniors at a local high school was conducted.The following table was produced from the data.Complete the missing parts. 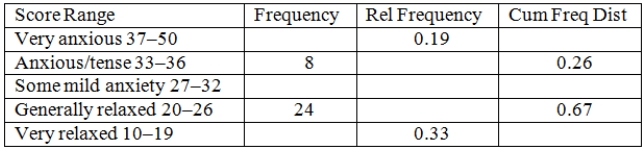
(Essay)
4.8/5 (25)
An example of manipulating a graphical display to distort reality is ___________.
(Multiple Choice)
4.7/5 (33)
The number of measurements falling within a class interval is called the ___________.
(Multiple Choice)
4.9/5 (30)
A bar chart is a graphic that can be used to depict qualitative data.
(True/False)
4.9/5 (41)
All of the following are used to describe qualitative data except the ___________.
(Multiple Choice)
4.8/5 (32)
The number of weekly sales calls by a sample of 25 pharmaceutical salespersons is below.24,56,43,35,37,27,29,44,34,28,33,28,46,31,38,41,48,38,27,29,37,33,31,40,50
Construct a stem-and-leaf plot.
(Essay)
4.9/5 (37)
In the first step of setting up a Pareto chart,a frequency table should be constructed of the defects (or categories)in decreasing order of frequency.
(True/False)
4.8/5 (28)
Which of the following is the best analytic dashboard graphical method for visualizing hierarchical information?
(Multiple Choice)
4.9/5 (37)
A ______________ can be used to differentiate the "vital few" causes of quality problems from the "trivial many" causes of quality problems.
(Multiple Choice)
4.9/5 (41)
When data are qualitative,the bars should never be separated by gaps.
(True/False)
4.8/5 (37)
The number of weekly sales calls by a sample of 25 pharmaceutical salespersons is below.24,56,43,35,37,27,29,44,34,28,33,28,46,31,38,41,48,38,27,29,37,33,31,40,50
Construct a histogram.
(Essay)
4.9/5 (40)
Filters
- Essay(0)
- Multiple Choice(0)
- Short Answer(0)
- True False(0)
- Matching(0)