Exam 2: Descriptive Statistics: Tabular and Graphical Methods
Exam 1: An Introduction to Business Statistics95 Questions
Exam 2: Descriptive Statistics: Tabular and Graphical Methods85 Questions
Exam 3: Descriptive Statistics: Numerical Methods57 Questions
Exam 4: Probability44 Questions
Exam 5: Discrete Random Variables71 Questions
Exam 6: Continuous Random Variables40 Questions
Exam 7: Sampling and Sampling Distributions52 Questions
Exam 8: Confidence Intervals126 Questions
Exam 9: Hypothesis Testing84 Questions
Exam 10: Statistical Inferences for Means and Proportions70 Questions
Exam 11: Statistical Inferences for Population Variances54 Questions
Exam 12: Experimental Design and Analysis of Variance81 Questions
Exam 13: Chi-Square Tests136 Questions
Exam 14: Simple Linear Regression Analysis95 Questions
Exam 15: Multiple Regression and Model Building119 Questions
Exam 16: Time Series Forecasting and Index Numbers71 Questions
Exam 17: Nonparametric Methods61 Questions
Exam 18: Decision Theory85 Questions
Select questions type
A graphical portrayal of a quantitative data set that divides the data into classes and gives the frequency of each class is a(n)___________.
(Multiple Choice)
4.8/5  (39)
(39)
In a Pareto chart,the bar for the "Other" category should be placed to the far left of the chart.
(True/False)
4.8/5 (37)
A ______________ shows the relationship between two variables.
(Multiple Choice)
4.8/5 (35)
Recently an advertising company called 200 people and asked them to identify the company that was in an ad running nationwide.They obtained the following results. 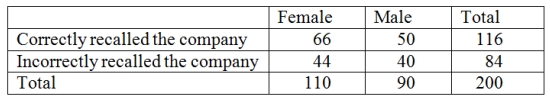 Construct a table of column percentages.
(Essay)
4.7/5 (34)
Key performance indicators are best represented by a data discovery method.
(True/False)
5.0/5 (34)
The following is a relative frequency distribution of grades in an introductory statistics course. 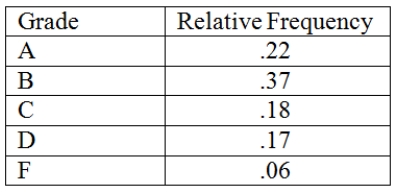 Construct a percent frequency bar chart for this data.
(Essay)
4.9/5 (34)
Sparklines always need to be displayed with either their axes or coordinates.
(True/False)
4.8/5 (32)
A histogram that tails out toward smaller values is ___________.
(Multiple Choice)
4.9/5 (35)
The number of weekly sales calls by a sample of 25 pharmaceutical salespersons is below.24,56,43,35,37,27,29,44,34,28,33,28,46,31,38,41,48,38,27,29,37,33,31,40,50
Construct an ogive plot.
(Essay)
4.8/5 (34)
An observation separated from the rest of the data is a(n)___________.
(Multiple Choice)
5.0/5 (35)
When developing a frequency distribution,the class (group)intervals should be ___________.
(Multiple Choice)
4.8/5 (40)
Sparklines are line charts often embedded with the text where they are being discussed.
(True/False)
4.9/5 (36)
A relative frequency curve having a long tail to the right is said to be ___________.
(Multiple Choice)
4.9/5 (46)
________ can be used to study the relationship between two variables.
(Multiple Choice)
4.8/5 (40)
A very simple graph that can be used to summarize a quantitative data set is called a(n)___________.
(Multiple Choice)
4.8/5 (31)
Filters
- Essay(0)
- Multiple Choice(0)
- Short Answer(0)
- True False(0)
- Matching(0)