Exam 15: Time-Series Forecasting and Index Numbers
Exam 1: Introduction to Statistics86 Questions
Exam 2: Charts and Graphs55 Questions
Exam 3: Descriptive Statistics59 Questions
Exam 4: Probability76 Questions
Exam 5: Discrete Distributions81 Questions
Exam 6: Continuous Distributions83 Questions
Exam 7: Sampling and Sampling Distributions87 Questions
Exam 8: Statistical Inference: Estimation for Single Populations82 Questions
Exam 9: Statistical Inference: Hypothesis Testing for Single Populations85 Questions
Exam 10: Statistical Inferences About Two Populations81 Questions
Exam 11: Analysis of Variance and Design of Experiments90 Questions
Exam 12: Simple Regression Analysis and Correlation98 Questions
Exam 13: Multiple Regression Analysis85 Questions
Exam 14: Building Multiple Regression Models78 Questions
Exam 15: Time-Series Forecasting and Index Numbers75 Questions
Exam 16: Analysis of Categorical Data77 Questions
Exam 17: Nonparametric Statistics76 Questions
Exam 18: Statistical Quality Control68 Questions
Exam 19: Decision Analysis79 Questions
Select questions type
The ratios of "actuals to moving averages" (seasonal indexes)for a time series are presented in the following table as percentages.  The final (completely adjusted)estimate of the seasonal index for Q1 is __________.
(Multiple Choice)
4.9/5  (31)
(31)
Analysis of data for an autoregressive forecasting model produced the following tables. 
 The results indicate that __________.
(Multiple Choice)
4.9/5 (27)
A time series with forecast values and error terms is presented in the following table.The mean squared error (MSE)for this forecast is ___________. 
(Multiple Choice)
4.9/5 (36)
The high and low values of the "ratios of actuals to moving average" are ignored when finalizing the seasonal index for a period (month or quarter)in time series decomposition.The rationale for this is to ________.
(Multiple Choice)
4.9/5 (28)
The long-term general direction of data is referred to as series.
(True/False)
5.0/5 (32)
Unweighted price indexes compare across the entire time period for which there is data.
(True/False)
4.8/5 (40)
In an autoregressive forecasting model,the independent variable(s)is (are)______.
(Multiple Choice)
4.9/5 (39)
A stationary time-series data has only trend but no cyclical or seasonal effects.
(True/False)
4.7/5 (35)
When forecasting with exponential smoothing,data from previous periods is _________.
(Multiple Choice)
4.8/5 (37)
When a trucking firm uses the number of shipments for January of the previous year as the forecast for January next year,it is using a naïve forecasting model.
(True/False)
4.8/5 (28)
Using a three-month moving average,the forecast value for October made at the end of September in the following time series would be ____________. 
(Multiple Choice)
4.9/5 (44)
The following graph of time-series data suggests a _______________ trend. 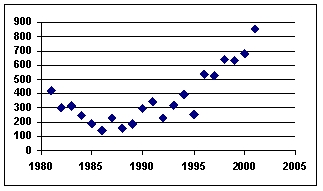

(Multiple Choice)
4.9/5 (35)
Jim Royo,manager of Billings Building Supply (BBS),wants to develop a model to forecast BBS's monthly sales (in $1,000's).He selects the dollar value of residential building permits (in $10,000)as the predictor variable.An analysis of the data yielded the following tables. 
 Jim's calculated value for the Durbin-Watson statistic is 1.14.Using = 0.05,the appropriate decision is: _________.
(Multiple Choice)
4.7/5 (34)
One of the ways to overcome the autocorrelation problem in a regression forecasting model is to increase the level of significance for the F test
(True/False)
4.8/5 (40)
Two popular general categories of smoothing techniques are averaging models and exponential models.
(True/False)
4.8/5 (39)
Using a three-month moving average,the forecast value for November in the following time series is ____________. 
(Multiple Choice)
4.8/5 (31)
An exponential smoothing technique in which the smoothing constant alpha is equal to one is equivalent to a regression forecasting model.
(True/False)
4.9/5 (37)
In exponential smoothing models,the value of the smoothing constant may be any number between ___________.
(Multiple Choice)
4.8/5 (36)
The following graph of a time-series data suggests a _______________ trend.
(Multiple Choice)
4.7/5 (38)
Using 2011 as the base year,the 2010 value of the Paasche' Price Index is ______. 
(Multiple Choice)
4.7/5 (28)
Filters
- Essay(0)
- Multiple Choice(0)
- Short Answer(0)
- True False(0)
- Matching(0)