Exam 12: Simple Regression Analysis and Correlation
Exam 1: Introduction to Statistics86 Questions
Exam 2: Charts and Graphs55 Questions
Exam 3: Descriptive Statistics59 Questions
Exam 4: Probability76 Questions
Exam 5: Discrete Distributions81 Questions
Exam 6: Continuous Distributions83 Questions
Exam 7: Sampling and Sampling Distributions87 Questions
Exam 8: Statistical Inference: Estimation for Single Populations82 Questions
Exam 9: Statistical Inference: Hypothesis Testing for Single Populations85 Questions
Exam 10: Statistical Inferences About Two Populations81 Questions
Exam 11: Analysis of Variance and Design of Experiments90 Questions
Exam 12: Simple Regression Analysis and Correlation98 Questions
Exam 13: Multiple Regression Analysis85 Questions
Exam 14: Building Multiple Regression Models78 Questions
Exam 15: Time-Series Forecasting and Index Numbers75 Questions
Exam 16: Analysis of Categorical Data77 Questions
Exam 17: Nonparametric Statistics76 Questions
Exam 18: Statistical Quality Control68 Questions
Exam 19: Decision Analysis79 Questions
Select questions type
A manager wants to predict the cost (y)of travel for salespeople based on the number of days (x)spent on each sales trip.The following model has been developed: y = $400 + 120x.If a trip took 4 days,the predicted cost of the trip is _____________.
(Multiple Choice)
4.8/5  (38)
(38)
Regression output from Minitab software includes an ANOVA table.
(True/False)
4.8/5 (38)
From the following scatter plot,we can say that between y and x there is _______. 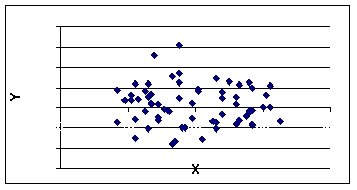
(Multiple Choice)
4.8/5 (41)
Given x,a 95% prediction interval for a single value of y is always wider than a 95% confidence interval for the average value of y.
(True/False)
4.9/5 (36)
The numerical value of the coefficient of determination must be _______.
(Multiple Choice)
4.8/5 (39)
Regression output from Minitab software directly displays the regression equation.
(True/False)
4.7/5 (44)
Abby Kratz,a market specialist at the market research firm of Saez,Sikes,and Spitz,is analyzing household budget data collected by her firm.Abby's dependent variable is monthly household expenditures on groceries (in $'s),and her independent variable is annual household income (in $1,000's).Regression analysis of the data yielded the following tables.  11eaa55d_2fe1_3078_85d2_59082a5460f1_TB3123_00 Abby's regression model is __________.s),and her independent variable is annual household income (in $1,000's).Regression analysis of the data yielded the following tables. Abby's regression model is __________." class="answers-bank-image d-inline" loading="lazy" > Abby's regression model is __________.s),and her independent variable is annual household income (in $1,000's).Regression analysis of the data yielded the following tables. Abby's regression model is __________." class="answers-bank-image d-inline" loading="lazy" > 11eaa55d_2fe1_3078_85d2_59082a5460f1_TB3123_00 Abby's regression model is __________.
(Multiple Choice)
4.9/5 (33)
For a certain data set the regression equation is y = 29 - 5x.The correlation coefficient between y and x in this data set _______.
(Multiple Choice)
4.9/5 (29)
The process of constructing a mathematical model or function that can be used to predict or determine one variable by another variable is called regression analysis.
(True/False)
4.9/5 (37)
From the following scatter plot,we can say that between y and x there is _______. 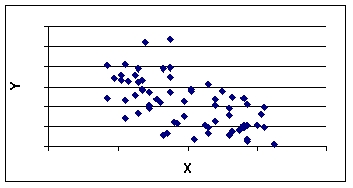
(Multiple Choice)
4.7/5 (28)
The following data is to be used to construct a regression model:  The regression equation is _______________.
(Multiple Choice)
4.8/5 (35)
One of the assumptions of simple regression analysis is that the error terms are exponentially distributed
(True/False)
4.8/5 (37)
In the regression equation,y=2.164+1.3657x n=6,the mean of x is 8.667,Sxx=89.333 and Se=3.44.A 95% prediction interval for y when x=8 is _________
(Multiple Choice)
4.8/5 (33)
In a regression analysis if SST = 200 and SSR = 200,r 2 = _________.
(Multiple Choice)
4.8/5 (31)
Prediction intervals get narrower as we extrapolate outside the range of the data.
(True/False)
4.8/5 (38)
The assumptions underlying simple regression analysis include ______________.
(Multiple Choice)
4.9/5 (39)
A researcher has developed a regression model from fourteen pairs of data points.He wants to test if the slope is significantly different from zero.He uses a two? tailed test and = 0.01.The critical table t value is _______.
(Multiple Choice)
4.9/5 (33)
From the following scatter plot,we can say that between y and x there is _______. 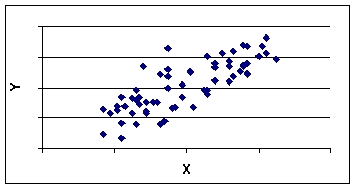
(Multiple Choice)
4.7/5 (30)
If there is perfect negative correlation between two sets of numbers,then _______.
(Multiple Choice)
4.8/5 (27)
Filters
- Essay(0)
- Multiple Choice(0)
- Short Answer(0)
- True False(0)
- Matching(0)