Exam 2: Charts and Graphs
Exam 1: Introduction to Statistics86 Questions
Exam 2: Charts and Graphs55 Questions
Exam 3: Descriptive Statistics59 Questions
Exam 4: Probability76 Questions
Exam 5: Discrete Distributions81 Questions
Exam 6: Continuous Distributions83 Questions
Exam 7: Sampling and Sampling Distributions87 Questions
Exam 8: Statistical Inference: Estimation for Single Populations82 Questions
Exam 9: Statistical Inference: Hypothesis Testing for Single Populations85 Questions
Exam 10: Statistical Inferences About Two Populations81 Questions
Exam 11: Analysis of Variance and Design of Experiments90 Questions
Exam 12: Simple Regression Analysis and Correlation98 Questions
Exam 13: Multiple Regression Analysis85 Questions
Exam 14: Building Multiple Regression Models78 Questions
Exam 15: Time-Series Forecasting and Index Numbers75 Questions
Exam 16: Analysis of Categorical Data77 Questions
Exam 17: Nonparametric Statistics76 Questions
Exam 18: Statistical Quality Control68 Questions
Exam 19: Decision Analysis79 Questions
Select questions type
The staff of Mr.Wayne Wertz,VP of Operations at Portland Peoples Bank,prepared a cumulative frequency ogive of waiting time for walk-in customers. 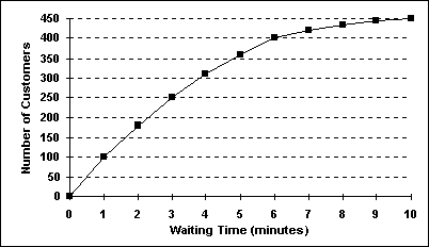 The percentage of walk-in customers waiting one minute or less was _________.
(Multiple Choice)
4.9/5  (33)
(33)
For any given data set,a frequency distribution with a larger number of classes will always be better than the one with a smaller number of classes.
(True/False)
4.9/5 (35)
Each day,the manager at Jamie's Auto Care Shop prepares a frequency distribution and a histogram of sales transactions by dollar value of the transactions.Friday's histogram follows. 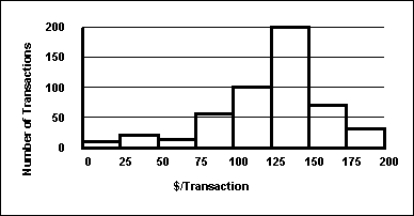 On Friday,the approximate number of sales transactions in the 75-under 100 category was _____________.
(Multiple Choice)
4.8/5 (32)
The staff of Mr.Wayne Wertz,VP of Operations at Portland Peoples Bank,prepared a frequency histogram of waiting time for drive up ATM customers. 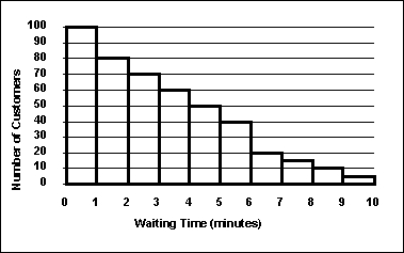 Approximately _____ drive up ATM customers waited less than 2 minutes.
(Multiple Choice)
4.8/5 (29)
In a histogram,the tallest bar represents the class with the highest cumulative frequency.
(True/False)
4.8/5 (37)
A recent survey of U.S.automobile owners showed the following preferences for exterior automobile colors: 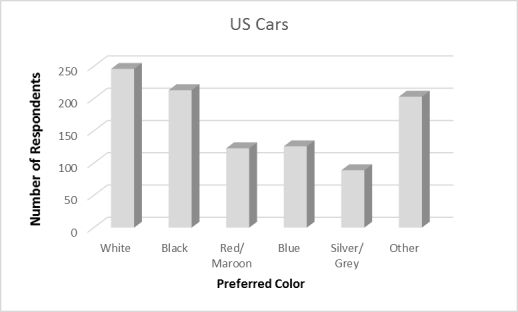 What are the top two color preferences for automobiles?
(Multiple Choice)
4.8/5 (34)
The difference between the highest number and the lowest number in a set of data is called the differential frequency.
(True/False)
4.8/5 (34)
Each day,the office staff at Oasis Quick Shop prepares a frequency distribution and an ogive of sales transactions by dollar value of the transactions.Saturday's cumulative frequency ogive follows. 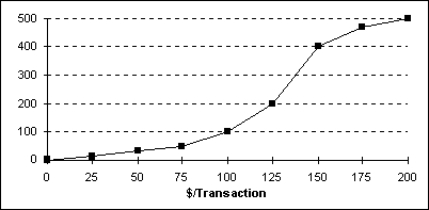 The total number of sales transactions on Saturday was _____________.
(Multiple Choice)
4.8/5 (34)
A summary of data in which raw data are grouped into different intervals and the number of items in each group is listed is called a frequency distribution.
(True/False)
4.8/5 (30)
Each day,the office staff at Oasis Quick Shop prepares a frequency distribution and an ogive of sales transactions by dollar value of the transactions.Saturday's cumulative frequency ogive follows.  The percentage of sales transactions on Saturday that were between $100 and $150 was _____________.
(Multiple Choice)
4.9/5 (29)
The 2010 and 2012 market share data of the three competitors (Alston,Baren,and Clemson)in an oligopolistic industry are presented in the following pie charts. 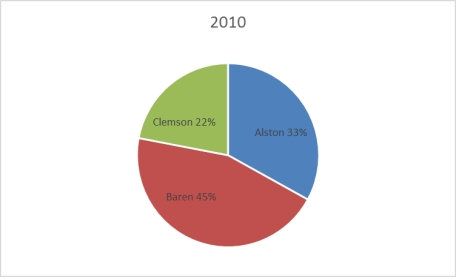
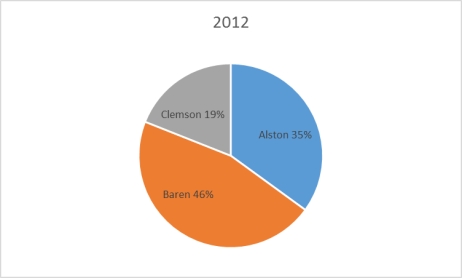 Which of the following is true?
(Multiple Choice)
4.7/5 (30)
A graphical representation of a frequency distribution is called a pie chart.
(True/False)
4.8/5 (31)
The following represent the ages of students in a class: 19,23,21,19,19,20,22,31,21,20
If a stem and leaf plot were to be developed from this,how many stems would there be?
(Multiple Choice)
4.7/5 (36)
The staffs of the accounting and the quality control departments rated their respective supervisor's leadership style as either (1)authoritarian or (2)participatory.Sixty-eight percent of the accounting staff rated their supervisor "authoritarian," and thirty-two percent rated him "participatory." Forty percent of the quality control staff rated their supervisor "authoritarian," and sixty percent rated her "participatory." The best graphic depiction of these data would be two ___________________.
(Multiple Choice)
4.9/5 (38)
Filters
- Essay(0)
- Multiple Choice(0)
- Short Answer(0)
- True False(0)
- Matching(0)