Exam 2: Charts and Graphs
Exam 1: Introduction to Statistics86 Questions
Exam 2: Charts and Graphs55 Questions
Exam 3: Descriptive Statistics59 Questions
Exam 4: Probability76 Questions
Exam 5: Discrete Distributions81 Questions
Exam 6: Continuous Distributions83 Questions
Exam 7: Sampling and Sampling Distributions87 Questions
Exam 8: Statistical Inference: Estimation for Single Populations82 Questions
Exam 9: Statistical Inference: Hypothesis Testing for Single Populations85 Questions
Exam 10: Statistical Inferences About Two Populations81 Questions
Exam 11: Analysis of Variance and Design of Experiments90 Questions
Exam 12: Simple Regression Analysis and Correlation98 Questions
Exam 13: Multiple Regression Analysis85 Questions
Exam 14: Building Multiple Regression Models78 Questions
Exam 15: Time-Series Forecasting and Index Numbers75 Questions
Exam 16: Analysis of Categorical Data77 Questions
Exam 17: Nonparametric Statistics76 Questions
Exam 18: Statistical Quality Control68 Questions
Exam 19: Decision Analysis79 Questions
Select questions type
The following graphic of cigarettes smoked (sold)per capita (CIG)and deaths per 100K population from lung cancer (LUNG)indicates _________ 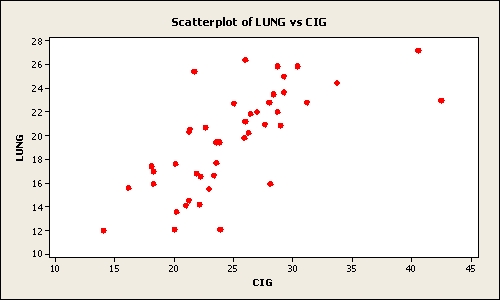
(Multiple Choice)
4.8/5  (33)
(33)
The following graphic of residential housing data (selling price and size in square feet)indicates _____________. 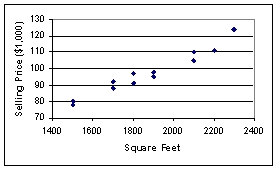
(Multiple Choice)
4.8/5 (24)
The cumulative frequency for a class is 27.The cumulative frequency for the next (non-empty)class will be _______.
(Multiple Choice)
4.8/5 (36)
The following is a bar chart of the self-reported race for 189 pregnant women. 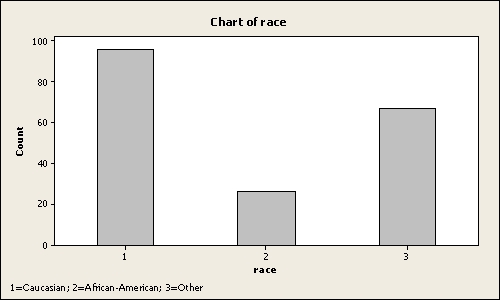 Approximately _____ percent of pregnant women are African-American
(Multiple Choice)
4.8/5 (44)
The 2010 and 2012 market share data of the three competitors (Alston,Baren,and Clemson)in an oligopolistic industry are presented in the following pie charts. 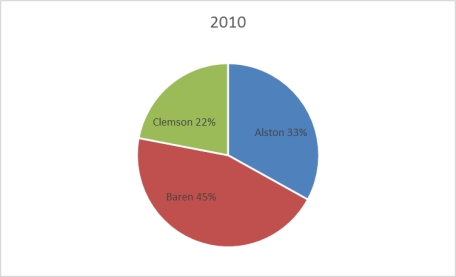
 Which of the following may be a false statement?
(Multiple Choice)
4.9/5 (44)
An instructor made a frequency table of the scores his students got on a test Score Frequency
30-under 40 1
40-under 50 4
50-under 60 5
60-under 70 10
70-under 80 20
80-under 90 10
90-under 100 5
Approximately what percent of students got more than 70?
(Multiple Choice)
4.8/5 (40)
The staff of Mr.Wayne Wertz,VP of Operations at Portland Peoples Bank,prepared a cumulative frequency ogive of waiting time for walk-in customers. 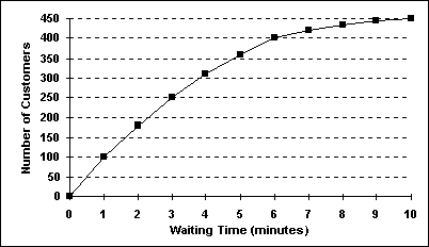 The total number of walk-in customers included in the study was _________.
(Multiple Choice)
4.7/5 (41)
In contrast to quantitative data graphs that are plotted along a numerical scale,qualitative graphs are plotted using non-numerical categories.
(True/False)
4.7/5 (34)
The United Nations Development Programme website provides comparative data by country on key metrics,such metrics as life expectancy over time.The table below show data on life
Expectancy over time in the United States. 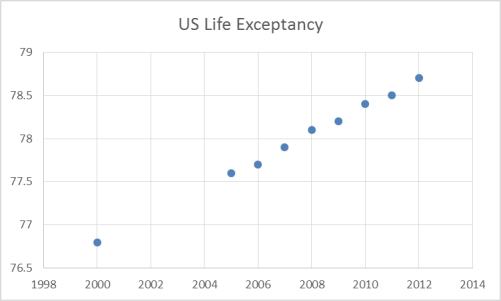 Which of the following statements are not true based on the scatterplot of U.S.Life Expectancy
Over time?
Which of the following statements are not true based on the scatterplot of U.S.Life Expectancy
Over time?
(Multiple Choice)
4.8/5 (35)
A recent survey of U.S.automobile owners showed the following preferences for exterior automobile colors: 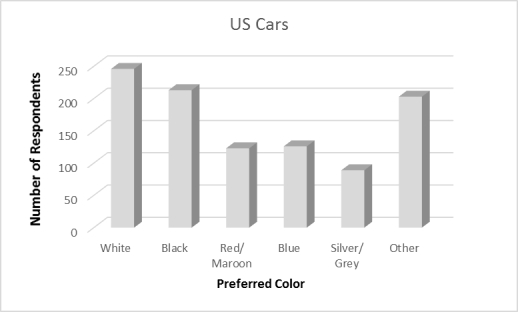 What type of graph is used to depict exterior automobile color preferences?
(Multiple Choice)
4.9/5 (45)
A scatter plot is useful for examining the relationship between two numerical variables.
(True/False)
4.9/5 (40)
The 2010 and 2012 market share data of the three competitors (Alston,Baren,and Clemson)in an oligopolistic industry are presented in the following pie charts.Total sales for this industry were $1.5 billion in 2010 and $1.8 billion in 2012.Clemson's sales in 2010 were ___________. 
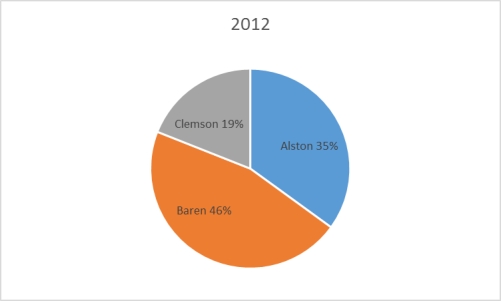
(Multiple Choice)
4.8/5 (37)
The following graphic of residential housing data (selling price and size in square feet)is a _____________. 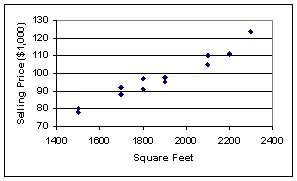
(Multiple Choice)
4.8/5 (34)
Suppose a market survey of 200 consumers was conducted to determine the likelihood of each consumer purchasing a new computer next year.The data were collected based on the income
Level of the consumer and are shown below:

 Using the table above,which of the following statements is true?
(Multiple Choice)
4.8/5 (44)
The staff of Ms.Tamara Hill,VP of Technical Analysis at Blue Sky Brokerage,prepared a frequency histogram of market capitalization of the 937 corporations listed on the American Stock Exchange in January 2013. 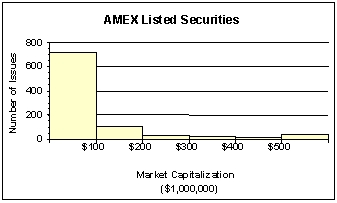 Approximately ________ corporations had capitalization exceeding $200,000,000.
(Multiple Choice)
4.8/5 (39)
Each day,the manager at Jamie's Auto Care prepares a frequency distribution and a histogram of sales transactions by dollar value of the transactions.Friday's histogram follows. 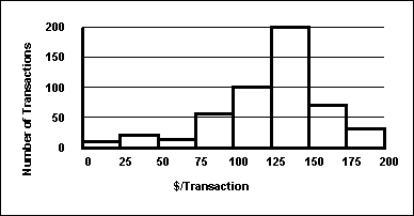 On Friday,the approximate number of sales transactions between $150 and $175 was _____________.
(Multiple Choice)
4.8/5 (29)
A cumulative frequency distribution provides a running total of the frequencies in the classes.
(True/False)
4.7/5 (34)
An instructor made a frequency table of the scores his students got on a test Score Frequency
30-under 40 1
40-under 50 4
50-under 60 5
60-under 70 10
70-under 80 20
80-under 90 10
90-under 100 5
The midpoint of the last class interval is _________.
(Multiple Choice)
5.0/5 (28)
Filters
- Essay(0)
- Multiple Choice(0)
- Short Answer(0)
- True False(0)
- Matching(0)